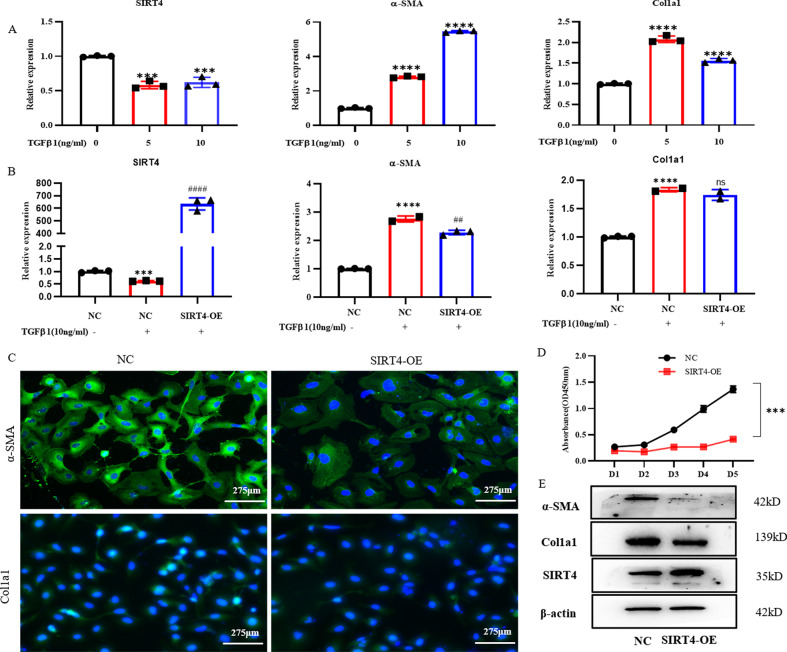
Fig. 5. Overexpression of SIRT4 ameliorated HSCs activation.
A, B Real‐time quantitative PCR analysis of the mRNA expression of fibrotic genes. C Immunofluorescence analysis of α‐SMA expression (scale bars = 275 μm). D Cell counting kit-8 (CCK-8) analysis of cell viability. E Western blot analysis of the protein expression of α‐SMA, Col1a1, and SIRT4. The data are reported as the mean ± SD. *p < 0.05; **p < 0.01; ***p < 0.001; ****p < 0.0001 versus the respective control. #P < 0.05, ##P < 0.01, ###P < 0.001, and ####P < 0.0001 versus the NC + TGFβ1 group.

