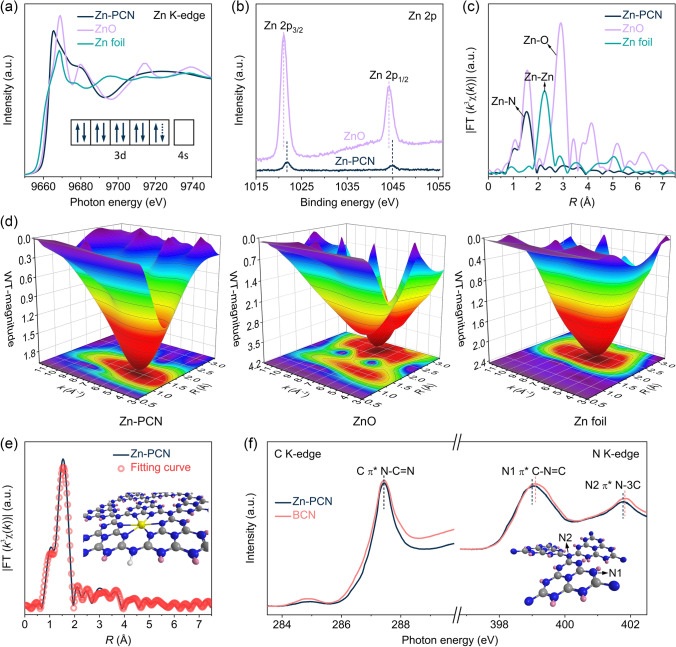
Fig. 2.
a Zn K-edge XANES spectra of Zn-PCN, ZnO and Zn foil. The inset in a shows the outer electron configuration of Zn single atom in Zn-PCN. b High-resolution Zn 2p XPS spectra of Zn-PCN and ZnO. c Zn K-edge k3-weighted FT-EXAFS spectra of Zn-PCN, ZnO and Zn foil. d WT-EXAFS spectra of Zn-PCN, ZnO and Zn foil. e Fitting curve of FT-EXAFS for Zn-PCN. The inset in e shows the structure model of Zn-PCN with one Zn atom coordinated by six N atoms. The gray, blue, white, yellow and pink spheres represent the C, N, H, Zn atoms and the unpaired electrons, respectively. f C K-edge and N K-edge XANES spectra of BCN and Zn-PCN. The inset in f illustrates the two types of N atoms in PCN network

