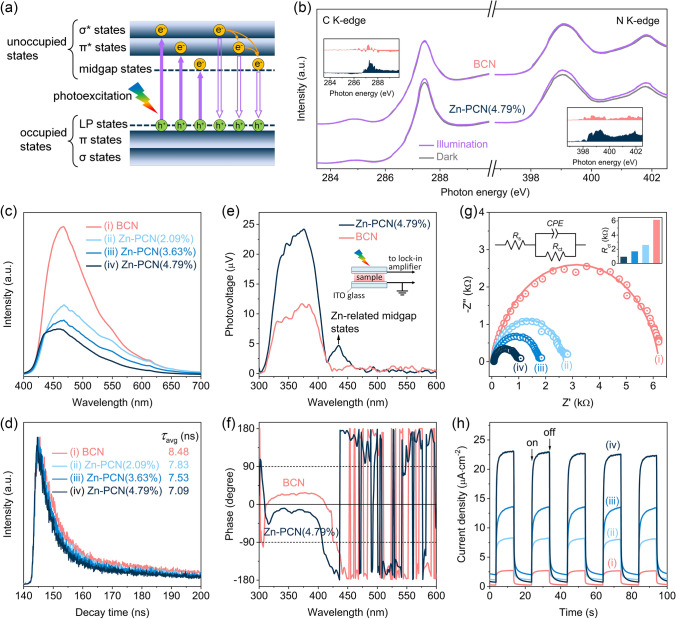
Fig. 4.
a Illustration of the electron transition processes in Zn-PCN. b C K-edge and N K-edge XANES spectra of BCN and Zn-PCN(4.79%) with or without illumination. The inset in b shows the spectral difference between being in dark and light. c Steady-state PL emission spectra and d time-resolved transient PL decay spectra of BCN and Zn-PCN. The excitation wavelength for all samples is 337 nm. e SPV spectra of BCN and Zn-PCN(4.79%) and f corresponding phase spectra. The inset in e shows the schematic setup for the SPV measurements. g Electrochemical impedance spectra of BCN and Zn-PCN at 0.8 V versus Ag/AgCl in 0.5 M Na2SO4 aqueous solution under light irradiation. The left inset in g is an equal circuit for the catalyst/electrolyte interfaces. Rs is the electrolyte resistance. Rct and CPE is the charge transfer resistance from the bulk to the surface of photocatalyst and the constant phase element, respectively. The right inset in g presents the corresponding Rct values. h Transient photocurrent density curves of BCN and Zn-PCN at 0.2 V versus Ag/AgCl in 0.5 M Na2SO4 aqueous solution under sequential illumination condition with an interval of 10 s on/off switch

