Figure 2.
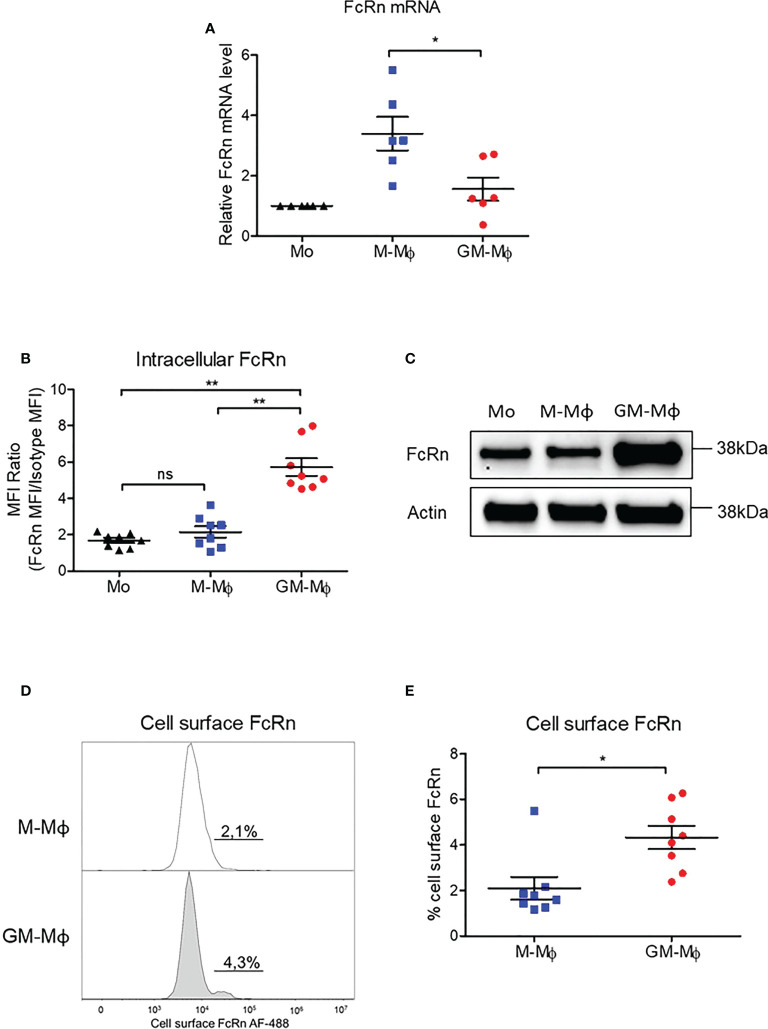
FCGRT mRNA and FcRn protein quantification in M-Mϕ and GM-Mϕ. Human monocytes were cultured with 60 ng/ml M-CSF or GM-CSF for 6 days. (A) FCGRT mRNA was assessed by RT-qPCR and relative expression levels were normalized to ACTIN and GAPDH mRNA (mean ± SD, N=6). (B) Results of flow cytometry of intracellular FcRn expression in monocytes on day 0 and M-Mϕ and GM-Mϕ on day 6. Data are MFI of anti-FcRn monoclonal antibody and isotype MFI ratio (mean ± SD, N=8). (C) Western blot analysis of protein extracts purified from monocytes (Mo) on day 0 and M-Mϕ and GM-Mϕ on day 6. (D) Flow cytometry of membrane FcRn levels expressed as percentage of positive cells. Histograms of one representative experiment on day 6 is presented for M-Mϕ and GM-Mϕ. (E) Mean percentage expression of FcRn cell-surface expression on M-Mϕ and GM-Mϕ (mean ± SD, N=8). Mo, monocytes; M-Mϕ, M-CSF–induced macrophages; GM-Mϕ, GM-CSF–induced macrophages; MFI, mean fluorescence intensity. ns = not significant, *p ≤ 0.05 and **p ≤ 0.01.

