Figure 6.
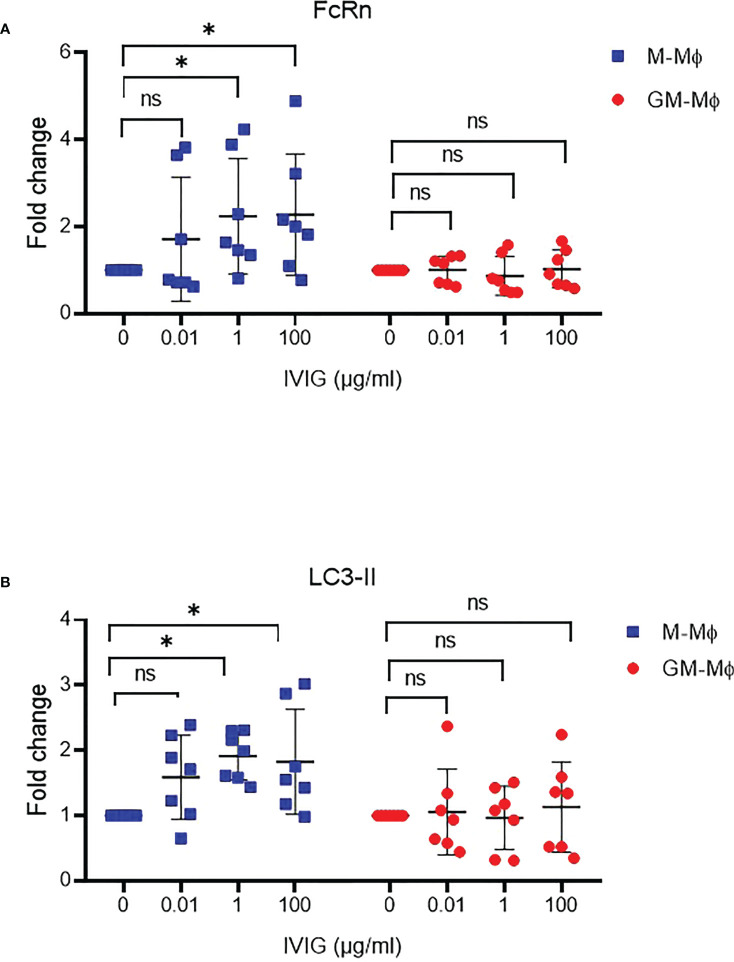
IVIG effect on FcRn expression and autophagy during macrophage differentiation. M-Mϕ and GM-Mϕ were cultured with IVIG 0.1, 1 and 100 µg/ml during differentiation. Western blot analysis of fold change in protein expression for FcRn (A) and LC3-II (B) quantification and normalization to GAPDH expression (mean ± SD, N=7). M-Mϕ, M-CSF–induced macrophages; GM-Mϕ, GM-CSF–induced macrophages; IVIG, intravenous immunoglobulin G. ns = not significant and *p ≤ 0.05.

