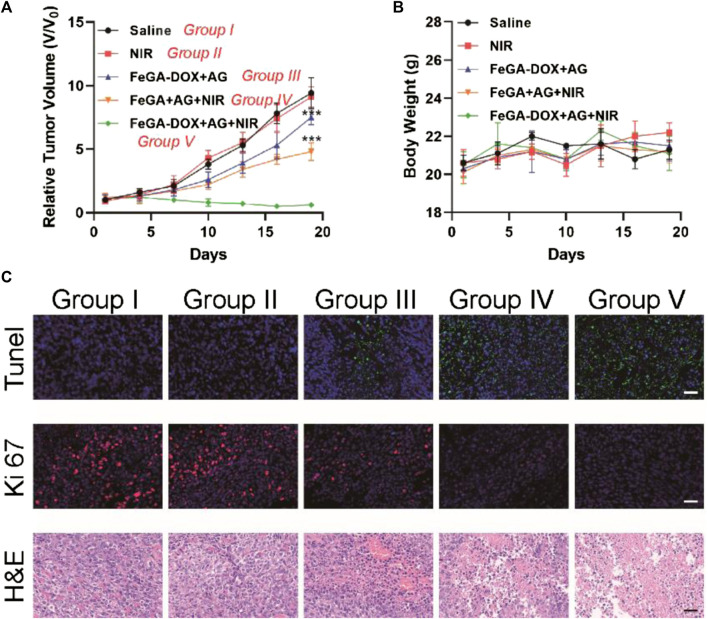
FIGURE 4.
(A) Tumour volume and (B) body weight of K7M2wt tumour-bearing mice in the saline, NIR, FeGA-DOX + AG, FeGA + AG + NIR and FeGA-DOX + AG + NIR groups. (C) Representative images of TUNEL, Ki-67 and H&E antibody staining in all treatment groups (Scale bar: 50 μm). p values in (A) were calculated by Tukey’s post-test (***p < 0.001).

