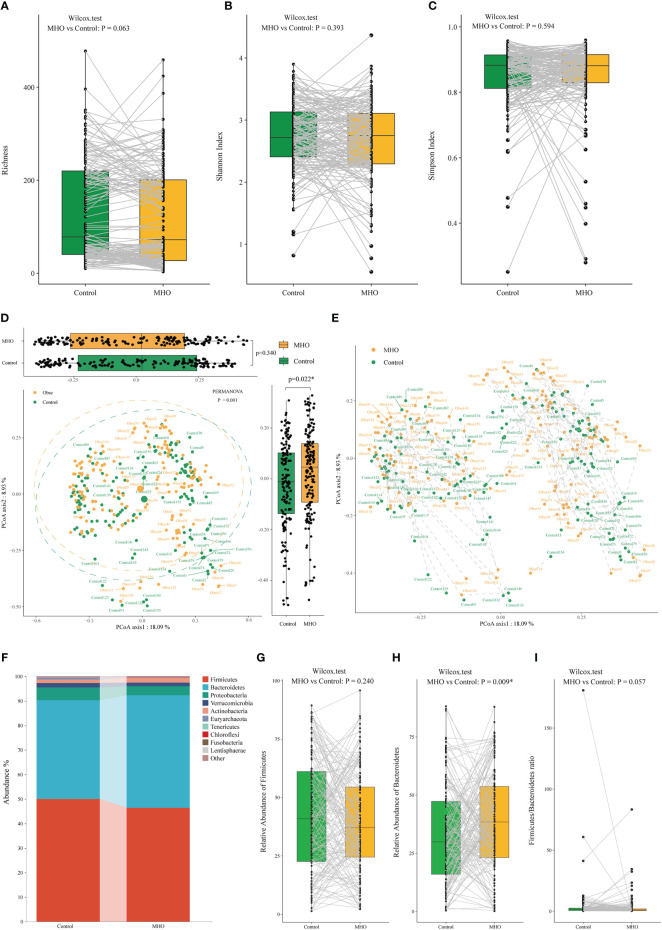
Figure 1.
Alteration of gut microbiota in MHO individuals compared with their matched non-obese healthy controls according to the human metagenomic data. Alpha diversity was evaluated by the observed Richness (A), Shannon index (B), and Simpson index (C). The gray lines indicate samples from MHO individuals and their matched non-obese healthy controls by age, sex, country, and Project ID. PCoAs of β-diversity were evaluated on species by Bray-Curtis distances (D). Visualization of the distance of paired samples was shown in (E). Each dot represents a sample. The difference in Bray-Curtis distances was calculated by the Mann–Whitney U test on Axis 1 (p=0.340) and 2 (p=0.022*), respectively. The dashed lines indicate a certain MHO patient was matched with a non-obese healthy control. The difference was calculated using the Wilcoxon Mann-Whitney U test. (F) The distribution of gut microbiota at the phylum levels in the both MHO and control groups. The abundance of Firmicutes (G), Bacteroidetes (H), and the F/B ratio (I) were compared between the two groups. MHO: Metabolically healthy obesity; PCoAs: Principal coordinate analyses.

