Figure 3.
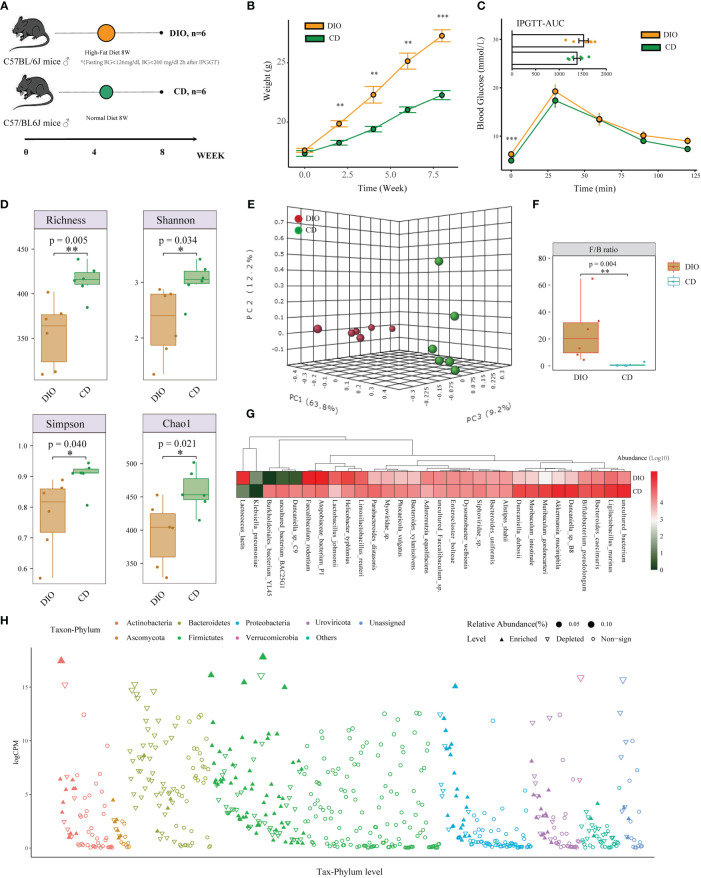
Alteration of Taxonomic Composition in MHO Mice. (A) Experimental design of mice. (B) Metabolic parameters of body weight (B) and IPGTT (C) were examined at the beginning of the 9th week. (D) Alpha diversity was evaluated by observed Richness, Shannon index, Simpson index, and Chao1 using the Student’s t-test. (E) PCoAs of β-diversity with the 3-dimensional presentation. (F) Firmicutes/Bacteroidetes ratio was compared using the Mann-Whitney U test between MHO and controls. (G) Heatmap visualization of the top 30 abundant species in MHO and controls. (H) Manhattan plots showing the changed composition of species in MHO by the edgeR algorithm. The color of each dot represents the different taxonomic affiliations of the species (phylum level), and the size corresponds to their relative abundance. The Y-axis represents log counts per million(CPM). The upward-pointing triangle indicates enriched species, whereas the downward-pointing triangle represents depleted ones. * p 0.05 ** p 0.01 *** p 0.001.

