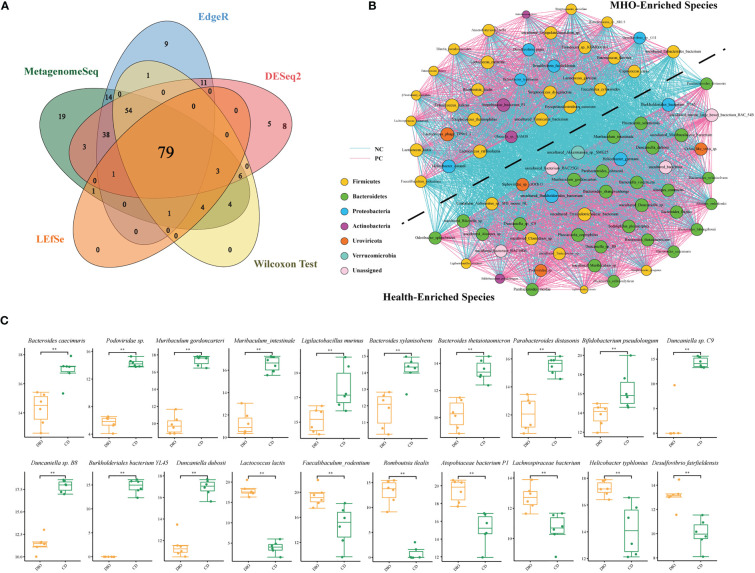
Figure 4.
Significantly-changed species in MHO mice. (A) Venn diagrams illustrating 79 species commonly identified using five different algorithms (MetagenomeSeq, EdgeR, DESeq2, LEfSe, and Wilcoxon Test). (B) Co-occurrence network visualization of the interactions among the above species. The lines connecting nodes (edges) represent a positive (light blue) or negative (pink) co-occurrence relationship. The color of each dot represents the different taxonomic affiliations of the species (phylum level), and the size corresponds to their relative abundance. (C) For some representative species among the above 79 species, the difference in abundance was compared using the Mann-Whitney U test. * p 0.05 ** p 0.01.

