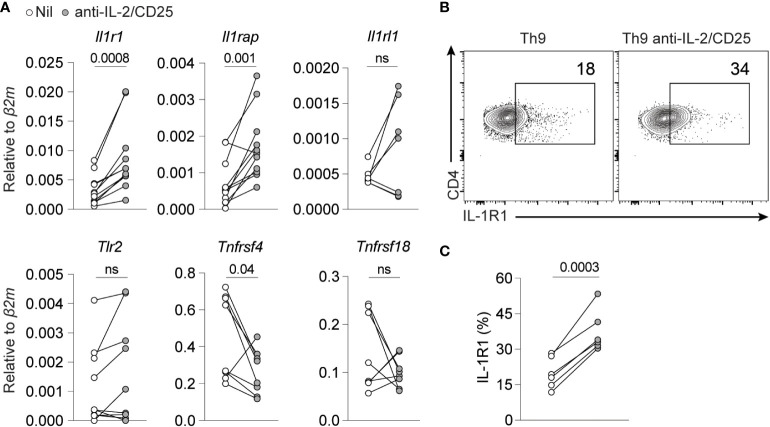
Figure 4.
IL-2 limiting conditions enhance IL-1R1 expression on Th9 cells. (A) NF-KB-inducing cell surface and cytokine receptor gene expression in standard Th9 or IL-2-deprived Th9 cells. Each point represents data from one mouse. The combined data represent at least a n=7 mice. (B) Representative contour plots of cell surface IL-1R1 expression on Th9 and IL-2-deprived Th9 cells on day 5 of culture. (C) Quantification of IL-1R expression from panel (B) Data are representative of Th9 cultures from 6-7 mice pooled from 3 individual experiments. Data were considered significantly different from paired t-test at p value ≤0.05. ns, non-significant.

