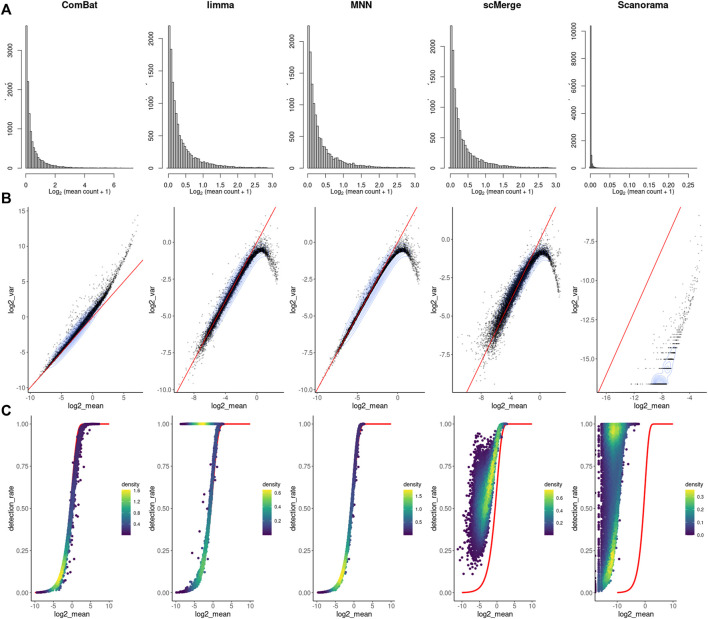
FIGURE 4.
Feature-level metrics for corrected study. (A) histograms of mean value, (B) mean-variance relationship - red line with intercept = 0 and slope = 1, (C) mean-detection rate relationship - red line indicates the expected distribution under a Poisson model. Individual points are colored by the number of neighboring points.

