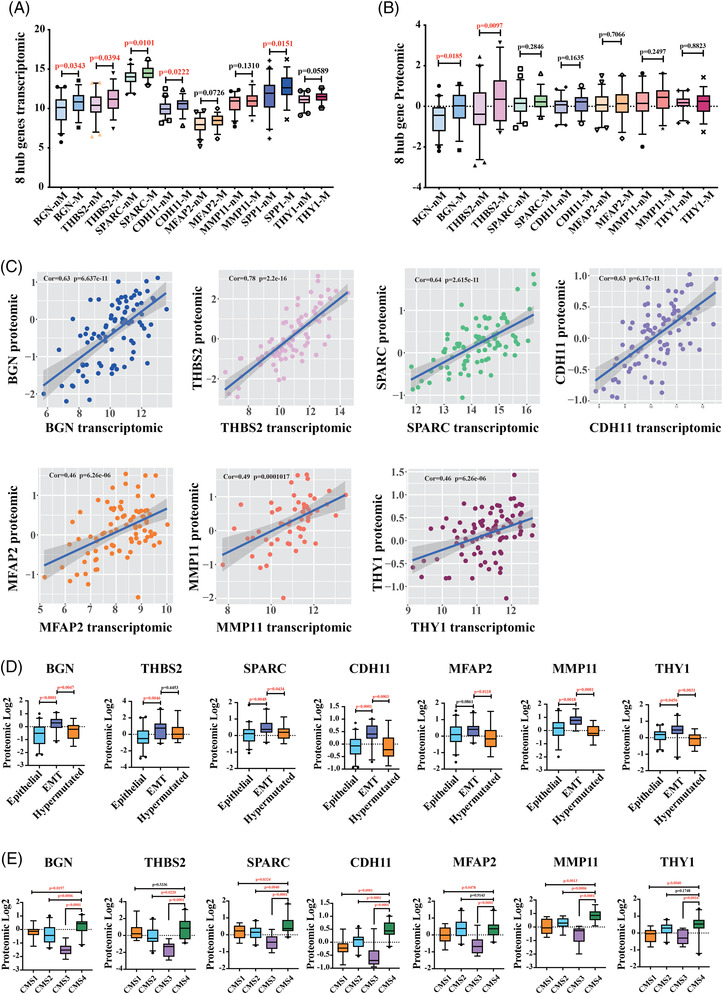
FIGURE 4.

Transcriptomic and proteomic expression pattern of eight signature genes analysis from CPTAC. (A) In CPTAC (The National Cancer Institute's Clinical Proteomic Tumour Analysis Consortium) transcriptomic data analysis, eight hub genes transcription levels in metastasis samples are significantly higher than no‐metastasis samples. (B) CPTAC proteomic data analysis indicated that protein expression level of BGN and THBS2 in metastasis samples are significantly higher than no‐metastasis samples (nM: no metastasis; M: metastasis). (C) Correlation analysis revealed a significant positive correlation between the proteomic and transcriptomic of 7 genes. (D) Protein expression level of seven signature genes in patients with epithelial, epithelial‐mesenchymal transition (EMT) and hypermutated phenotype. (E) Protein expression level of seven signature genes in patients from four different consensus molecular subtypes (CMS1∼4)
