
Figure 11.
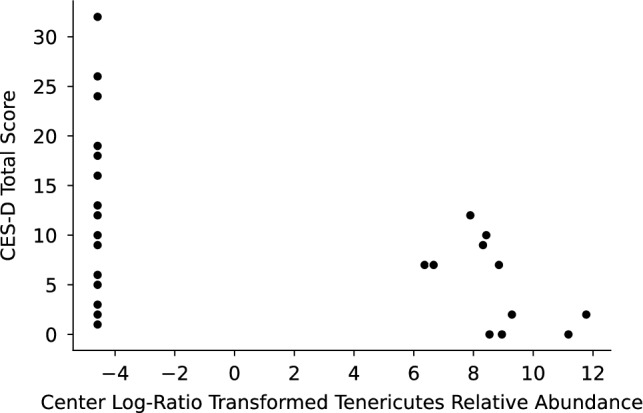
A scatterplot shows center log-ratio-transformed relative abundances of the phylum Tenericutes plotted against Center for Epidemiological Studies Depression Scale (CES-D) total score. Each dot represents the relative abundance of the phylum Tenericutes in one sample and the corresponding participant’s total CES-D score. A Spearman correlation test revealed a negative correlation between Tenericutes relative abundance and CES-D score (r = − 0.5, p = 0.002), indicating that a higher relative abundance of Tenericutes was associated with lower severity of depressive symptoms.