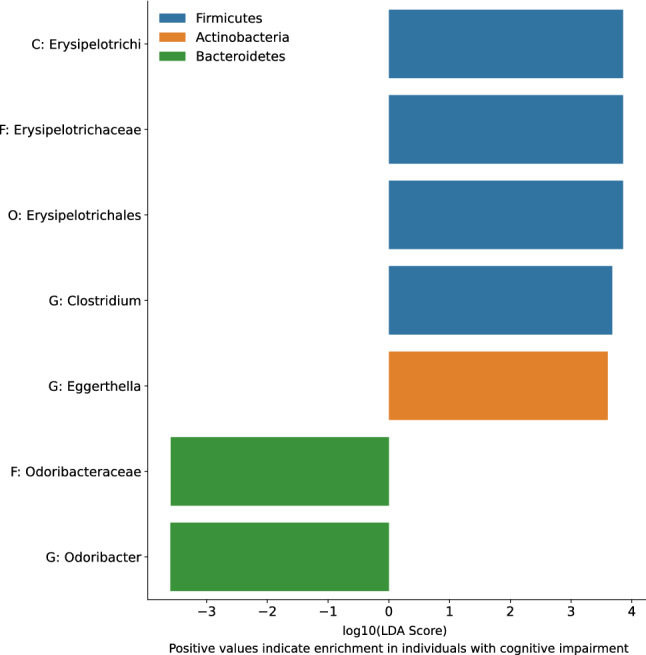
Figure 13.

Linear discriminant analysis Effect Size (LEfSe) scores for taxa identified to be enriched in individuals with high perceived cognitive impairments scores (FACT-Cog < 60) relative to participants with low cognitive impairment as assessed by FACT-Cog perceived cognitive impairments subscales. LEfSe Scores are given as the logarithm (base 10) of their importance score for linear discriminant analysis (LDA). Higher absolute values of the LEfSe scores indicate stronger enrichment in their respective groups. Positive values on the x axis indicate enrichment in participants with high cognitive impairment scores, whereas negative values indicate enrichment in participants with low cognitive impairment scores. Color represents the phylum of each taxon identified. C, class; O, Order; F, family; G, genus.
