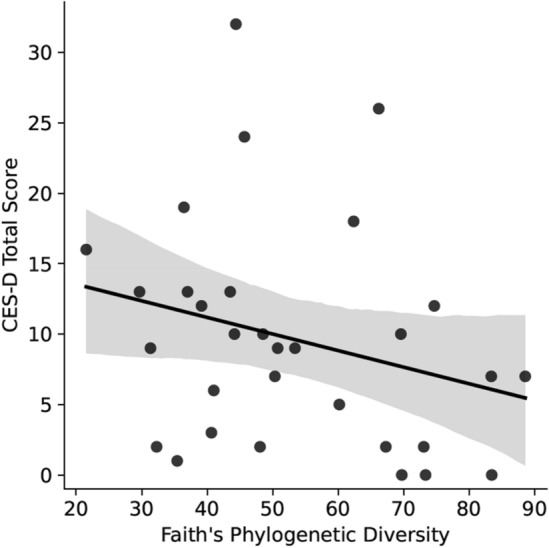
Figure 3.

A scatterplot with a fitted linear model shows Center for Epidemiological Studies Depression Scale (CES-D) total score as a function of participants’ microbiome’s Faith’s phylogenetic diversity. Each dot represents the participant’s CES-D score in relation to the alpha diversity of the participant’s fecal microbiome sample. A high CES-D score indicates higher depression symptom severity. The solid line represents the line of best fit, and the shaded area represents a 95% confidence interval.
