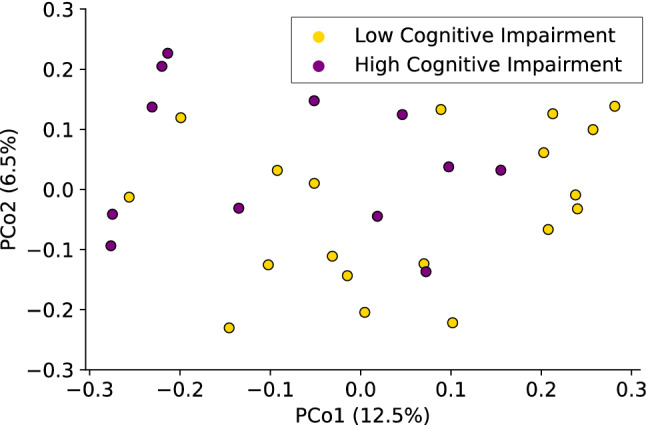
Figure 6.

An unweighted UniFrac principal coordinates analysis shows an ordination of microbiome data, colored by self-reported FACT-Cog subscale perceived cognitive impairments status. Each dot represents the fecal microbiome of one participant’s sample. Purple dots indicate participants with high perceived cognitive impairment (FACT-Cog subscale perceived cognitive impairments < 60), whereas yellow dots represent participants with low perceived cognitive impairment. PCo1 accounts for 12.5% of the observed variation, while PCo2 accounts for 6.5% of observed variation.
