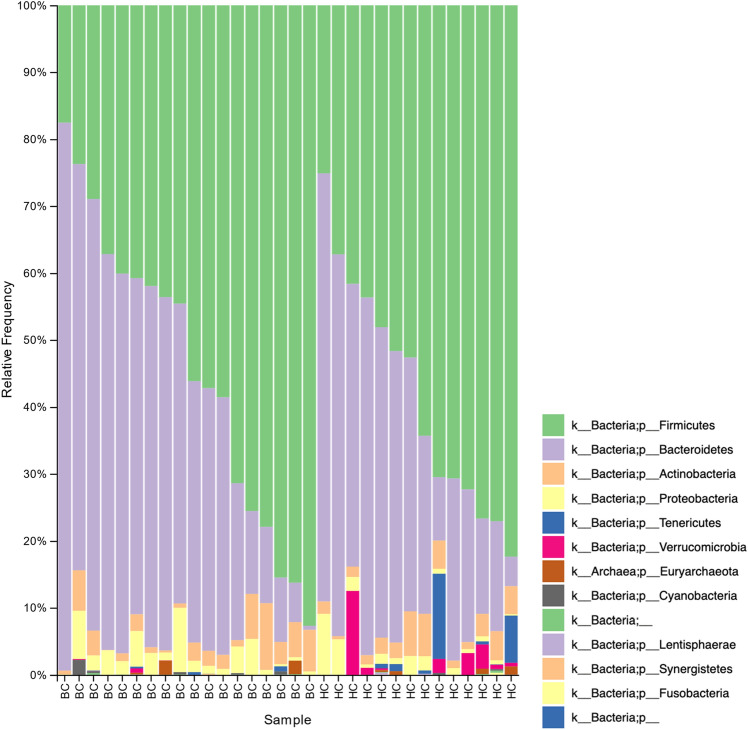
Figure 7.
Stacked bar chart shows relative abundances of bacteria at the phylum level in the fecal microbiome of women who were diagnosed with and undergoing chemotherapy treatment for breast cancer (BC) versus healthy controls (HC). From top to bottom, stacked bars for each phylum are in order of decreasing average relative abundance and follow the order listed in the legend. k, kingdom; p, phylum; BC, women who were diagnosed with and undergoing chemotherapy treatment for breast cancer; HC, healthy controls.

