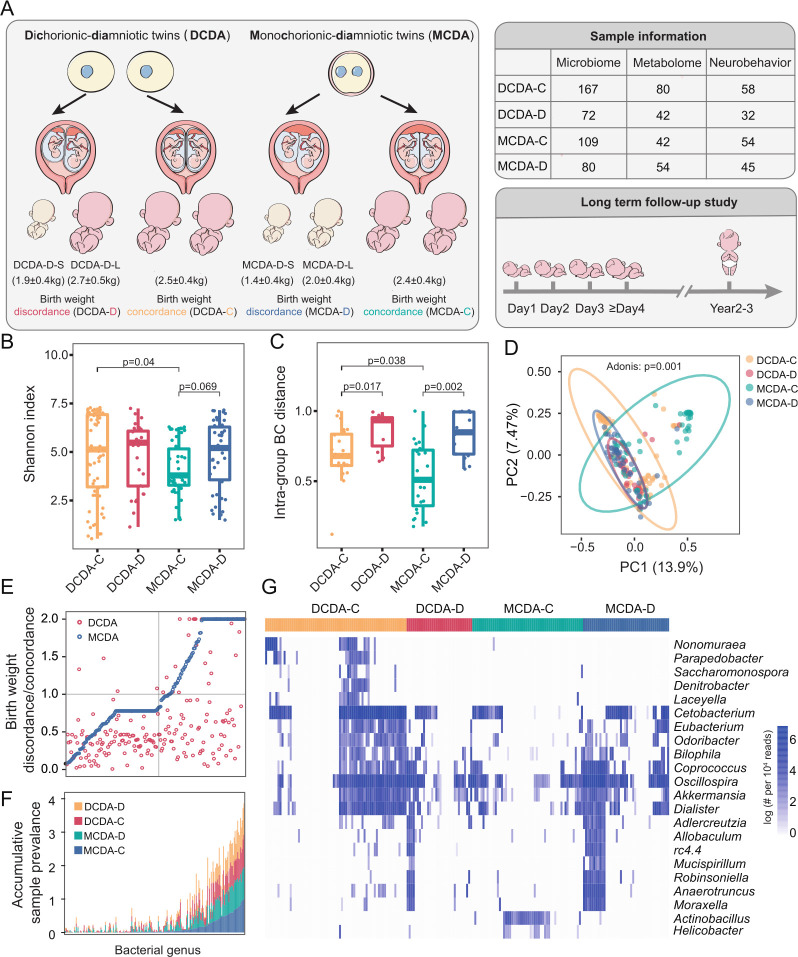
Figure 1.
Overview of the twin cohort and the influence of the intrauterine environment on the colonisation of the gut microbiota. DCDA-C and DCDA-D represent DC twins with birth weight concordance and birth weight discordance, respectively. MCDA-C and MCD represent MC twins with birth weight concordance and birth weight discordance, respectively. (A) The cohort of 150 twin pregnancies was divided into four groups based on chorionicity and discordance of fetal birth weight. The number of samples in each twin group is listed in the right table for gut microbiome profiling, metabonomics and follow-up survey. (B) The comparison of alpha diversities of gut microbiota among DCDA-C, DCDA-D, MCDA-D and MCDA-C groups. (C) Bray-Curtis distances were calculated and compared among the four groups. Statistical significance was determined by Wilcoxon’s rank-sum test. (D) Principal component analysis plot of neonatal gut microbiota in the DCDA-C, DCDA-D, MCDA-D and MCDA-C groups. Ellipses represent a 95% CI. (E) The ratio of the average relative abundance of each taxon in discordance and concordance of fetal birth weight in DC twins (red nodes) and MC twins (blue nodes). The x-axis represents different bacteria. (F) The cumulative frequency of discriminatory taxa in four group. The x-axis refers to discriminatory taxa among four groups. The y-axis represents the cumulative sample frequency of each taxon in the corresponding group. (G) The clustering of discriminatory taxa in the four groups, which is shown using the Pheatmap package in R. DC, dichorionic; MC, monochorionic.

