Figure 5.
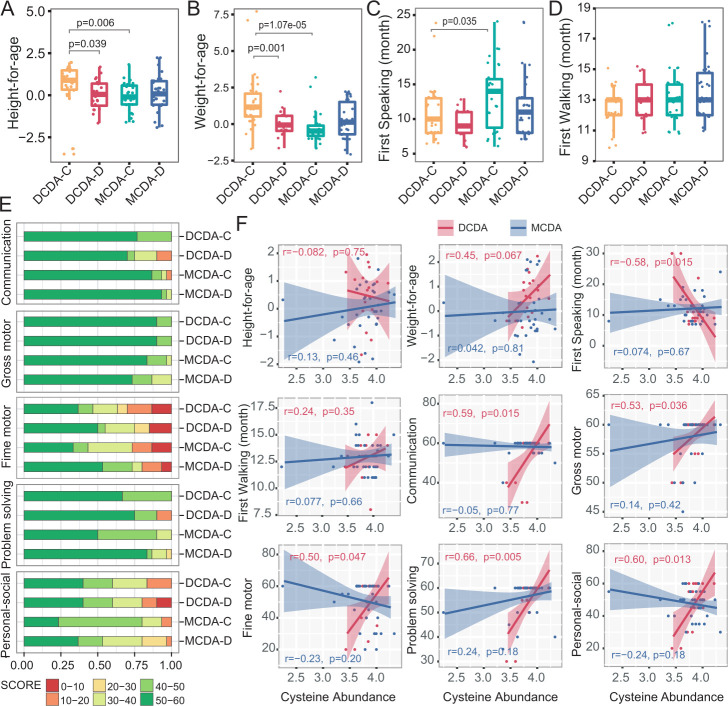
Correlation between neonatal faecal metabolites and physical and neurocognitive development later in life. DCDA-C and DCDA-D represent DC twins with birth weight concordance and birth weight discordance, respectively. MCDA-C and MCDA-D represent MCDA twins with birth weight concordance and birth weight discordance, respectively. (A–D) Comparison of height-for-age, weight-for-age, first speaking time and first walking time among the DCDA-C, DCDA-D, MCDA-C and MCDA-D groups. Statistical significance was determined by Wilcoxon’s rank-sum test. (E) Comparison of the percentage of score areas in the four groups for each developmental domain of the Ages and Stages Questionnaires third edition subscale. (F) The correlation between the faecal cysteine concentration and evaluation indices of physical and neurocognitive development. The shadow around the linear regression trendline shows the 95% CI. DC, dichorionic; DCDA, dichorionic-diamniotic; MC, monochorionic; MCDA, monochorionic-diamniotic.

