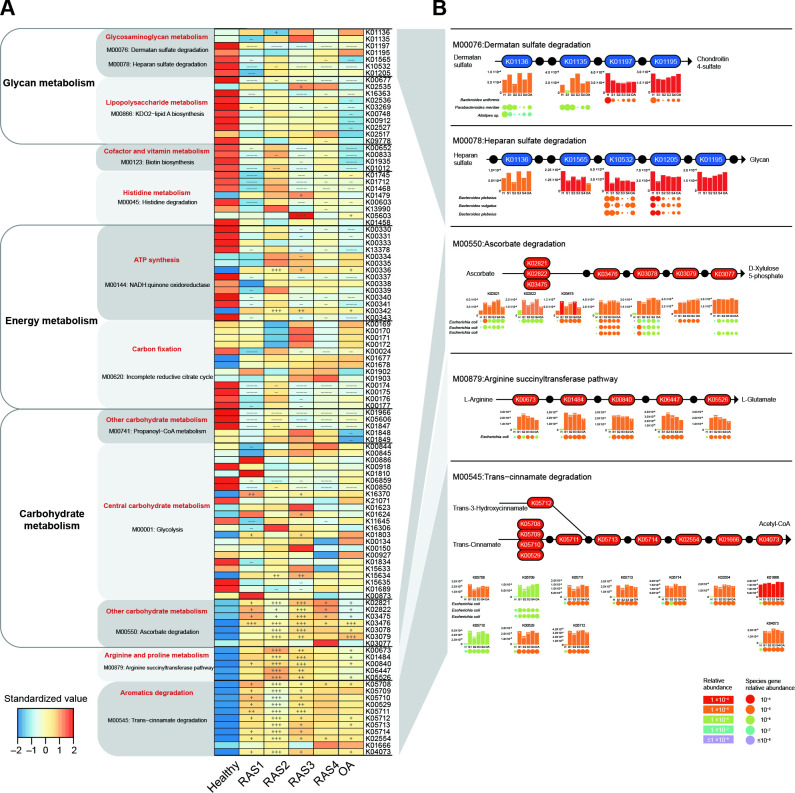
Figure 1.
Stage-specific microbial functional profiles. Gene abundances were assessed for elevation or depletion in each of the arthritis stages, RAS1 (n=15), RAS2 (n=21), RAS3 (n=18), RAS4 (n=22) and OA (n=19) compared with the healthy individuals (n=27). (A) Relative abundance of KO genes in the KEGG modules that were significantly correlated with arthritis (q<0.1 or qpartial <0.1, see online supplemental figure S1). KO genes with a prevalence of 5% or higher are shown. (B) KO genes involved in specific KEGG pathway modules in (A) are shown in the KEGG pathway maps. Each box in a pathway represents a KO gene and is marked in red for elevation or in blue for depletion at any of the stages compared with healthy individuals. Bar plots show relative gene abundances averaged over samples within each of the five groups (healthy (H), RAS1 (S1), RAS2 (S2), RAS3 (S3), RAS4 (S4) and OA) and are coloured according to the values. Each KO gene is composed of MGS genes represented by circles. The sizes and colours of the circles are proportional to the relative abundances of the MGS genes. MGS genes are grouped into one row and indicated by the taxonomic name. The three MGS that most drove the correlation of the KEGG modules with arthritis types are shown. In all panels, significant changes are denoted as follows: +++, elevation with p<0.005; ++, elevation with p<0.01; +, elevation with p<0.05; −−−, depletion with p<0.005; −−, depletion with p<0.01; −, depletion at p<0.05; Mann-Whitney-Wilcoxon test. KEGG, Kyoto Encyclopaedia of Genes and Genomes; KO, KEGG ortholog; MGS, metagenomic species; OA, osteoarthritis.

