Figure 3.
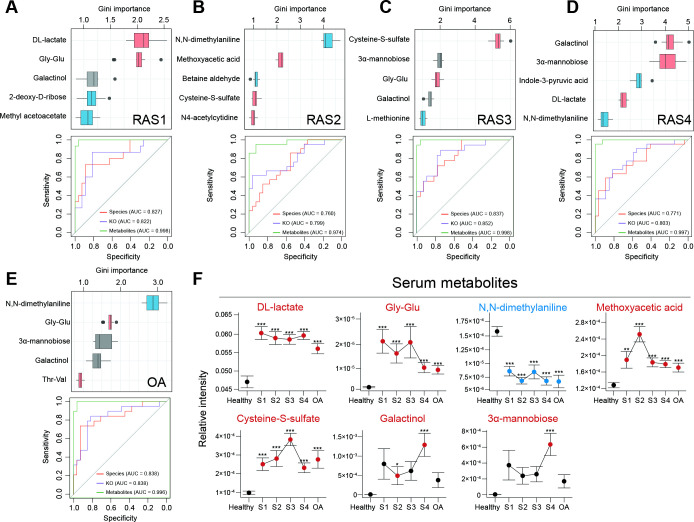
Multiomics diagnostic potential for the RA stage. A random forest algorithm was performed on 6224 KOs, 232 microbial species and 277 plasma metabolites in RAS1 (A), RAS2 (B), RAS3 (C), RAS4 (D) and OA (E). The Gini importance of the top five most discriminant metabolites are displayed. Boxes represent the IQR between the first and third quartiles and the line inside represents the median. Whiskers denote the lowest and highest values within the 1.5×IQR from the first and third quartiles, respectively. Boxes are marked in a specific colour to show the significant elevation (p<0.05, red, Mann-Whitney-Wilcoxon test) or depletion (p<0.05, blue, Mann-Whitney-Wilcoxon test) of the features in each of the arthritis stages compared with the healthy group. The ROC curves of the random forest model using microbial species, KOs, or metabolites were plotted, with AUC calculated by 10 randomised 10-fold cross-validation. The colour of the curve represents the category of the used features. (F) The dot plots show stage-specific abundance or concentration (mean±SE) of plasma metabolites, which are specified in (A–E). Four RA stages are connected to display the variance. Dots are coloured differently if the features are significantly elevated (red) or significantly depleted (blue), as compared with those of the healthy group. *p<0.05, **p<0.01, ***p<0.005; Mann-Whitney-Wilcoxon test. AUC, area under curve; KEGG, Kyoto Encyclopaedia of Genes and Genomes; KO, KEGG ortholog; OA, osteoarthritis; RA, rheumatoid arthritis; ROC, receiver operating characteristic.

