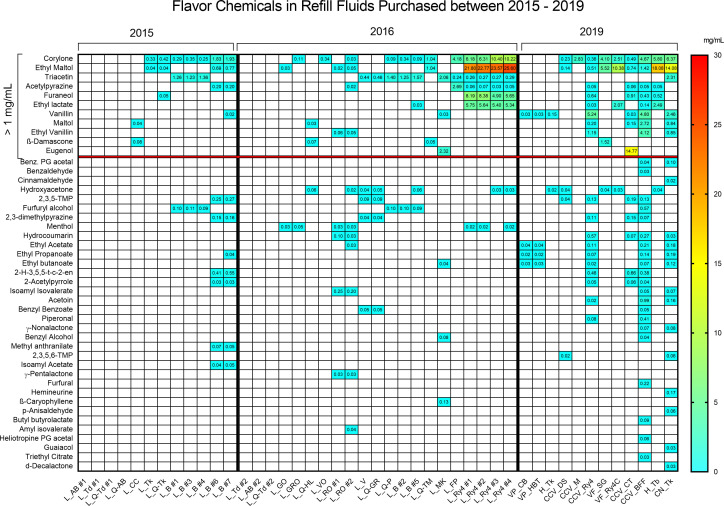
Figure 3.
Heat map showing individual flavour chemicals in refill fluids purchased in 2015, 2016 and 2019. The y-axis shows flavour chemicals ordered by high versus low concentrations, and the x-axis represents product codes as described in online supplemental table S1. Most flavour chemicals were present in low concentrations. However, increases in the concentrations of several commonly used flavour chemicals are seen in products purchased in 2016 and 2019. 2-H-3,5,5-t-c-2-en, 2-Hydroxy-3,5,5-trimethyl-cyclohex-2-en; TMP, trimethylpyrazine.

