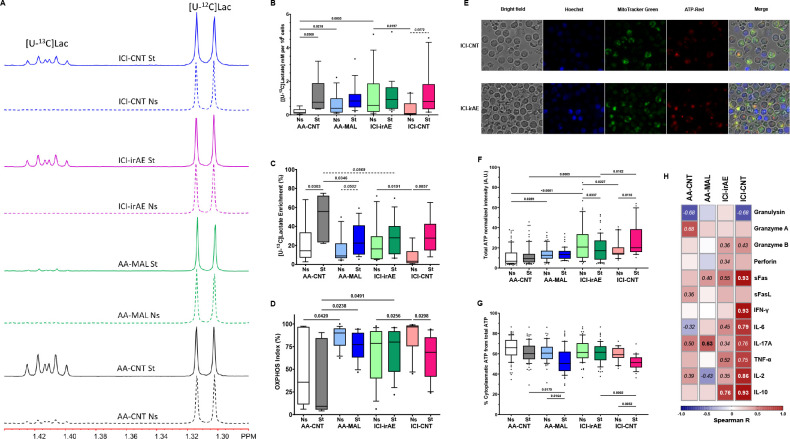
Figure 2.
irAE CD8 present a Warburg effect-like phenotype when resting and on TCR-stimulation undergo a Crabtree effect-like metabolic shift. (A) Representative 1H NMR sub-spectra of cell-culture media for each group of CD8, either unstimulated or TCR-stimulated. The region covers the [U-12C]-lactate methyl signal and the 13C satellite at higher frequency arising from [U-13C]-lactate. Each spectrum has been normalised separately to its [U-12C]-lactate methyl signal. (B–D) The concentration of [U-13C]-lactate in the cell-culture medium (B), [U-13C]-lactate enrichment (C) and OXPHOS-rate (D) before and after TCR–mediated stimulation for each group. Results are shown as box plots. Each box represents the 25th to 75th percentiles. Lines inside the boxes represent the median. Lines outside the boxes represent the 10th and 90th percentiles. Dots represent outliers. For all panels, AA-CNT n=18; AA-MAL n=16; ICI-irAE n=19; and ICI-CNT n=10. (E) Representative microscopy images of unstimulated ICI-irAE and ICI-CN CD8. (F) Total ATP produced by in vitro cultured CD8 without stimulation or with TCR-mediated stimulation, quantified by measuring the relative ATP-Red fluorescence. Each box represents the 25th to 75th percentiles of nine technical replicates for each patient (AA-CNT n=6; AA-MAL n=6; ICI-irAE n=7; and ICI-CNT n=3). Lines inside the boxes represent the median, lines outside the boxes represent the 10th and 90th percentiles, and dots represent outliers. (H) The correlation between [U-13C]-lactate production and cytokines/cytotoxic molecules release on TCR-mediated stimulation. Numbers show correlations with Spearman R>|0.3|, bold numbers represent p<0.05. AA-CNT, autoimmune arthritis; AA-JAKi, autoimmune arthritis Janus-kinase inhibitor; AA-MAL, autoimmune arthritis malignancy; GC, glucocorticoids; ICI-irAE, immune checkpoint inhibitor-immune-related adverse event; TCR, T-cell receptor.

