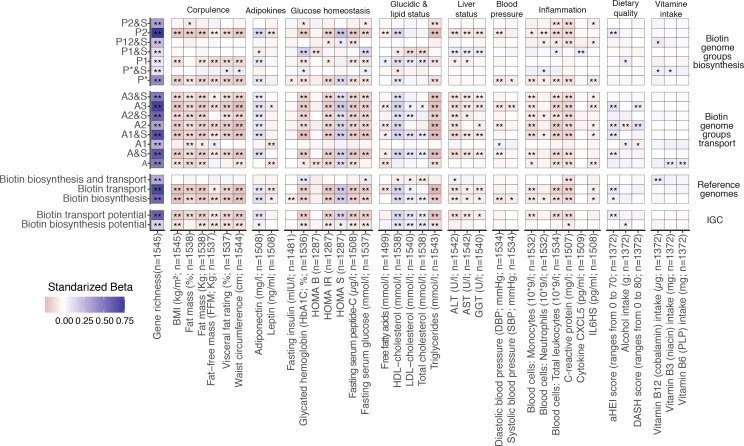
Figure 2.
Association between microbiome biotin status and host metabolic and inflammation markers in the MetaCardis subcohort. Heatmap indicating adjusted associations between log-10 transformed QMP abundance profiles of metagenomic signatures regarding biotin production and transport with clinical and lifestyle factors. The y-axis represents independent variables and the variables in the x-axis are the dependent variable (n=1545 individuals). These models were adjusted for the country of recruitment and age. (*P value<0.05; **FDR<0.05. Clinical and lifestyle variables for which no association with FDR<0.05 was found are not included in the heatmap). The color tones correspond to effect sizes represented by standardized beta coefficients from the adjusted linear regression models. Biosynthesis and transport genome groups were defined according to the nomenclature defined in Rodionov et al.15 Briefly, these included 3 groups of strict biotin producers (P1, P2, P* groups) harboring all 4 genes common to the different pathway variants of biotin biosynthesis from pimelate (P2) or pimeloyl-ACP (P1, P*). This also included 8 groups of strict biotin auxotrophs A&S/A groups; microorganisms not capable of biotin production 45 and with (A&S groups) or without (A groups) genes involved in biotin transport) with different levels of incompletion in the 4 core biotin biosynthesis genes (harboring from 1 to 3 biosynthetic genes at most), and 4 groups of biotin producers that also harbors genes coding for biotin transport (P&S groups). ALT, alanine aminotransferase; AST, aspartate aminotransferase; BMI, body mass index; CXCL5, C-X-C motif chemokine ligand 5; GGT, γ-glutamyltransferase; HDL, high-density lipoprotein. LDL, low-density lipoprotein.

