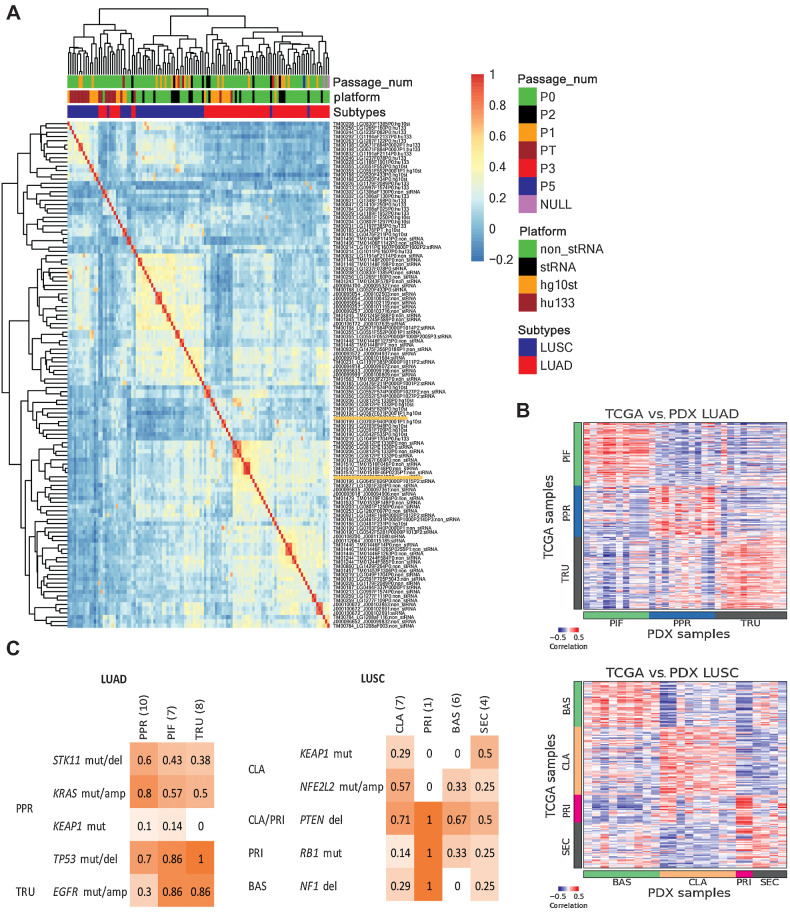
Figure 4.
Gene expression in lung cancer PDX models. A, Hierarchical clustering of gene expression percentile rank z-score for all lung cancer PDX samples and platforms. The heatmap is based on correlation values of expression percentile rank z-score expression for LUSC and LUAD PDX samples from sequencing and array platforms. The top horizontal color bars indicate the library preparation methods and platforms, subtype designation, and passage number. Sample labels are indicated by model ID, sample ID, and library preparation/platform. B, Expression (quantile-normalized raw RSEM counts) correlation of nearest template prediction genes between TCGA (LUAD, n = 230; LUSC, n = 178) and PDX (LUAD, n = 36; LUSC, n = 24) samples for LUAD and LUSC. The color bars indicate the subtype labels for TCGA and subtype predictions for PDX. C, Proportion of PDX models with mutations reported to be enriched in LUAD and LUSC subtypes as indicated on the left. LUAD subtypes: proximal-inflammatory (PIF), proximal-proliferative (PPR), terminal respiratory unit (TRU). LUSC subtypes: basal (BAS), classical (CLA), primitive (PRI), and secretory (SEC).

