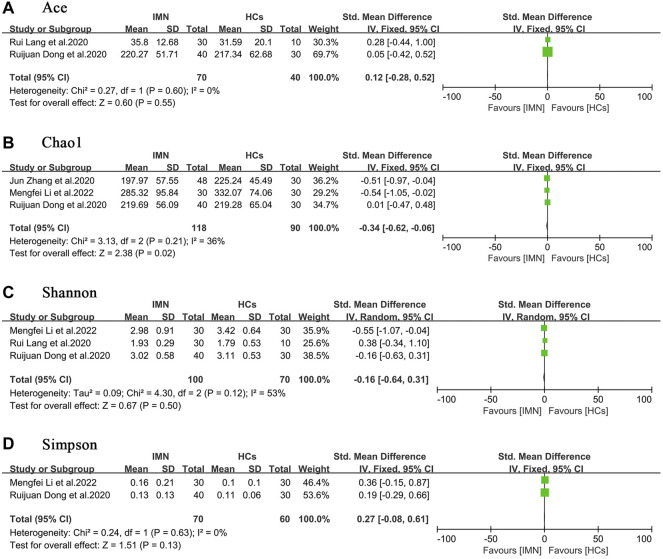
FIGURE 2.
Forest plots of alpha diversity in the gut microbiota of patients with IMN compared with HCs. (A) Ace index, SMD = 0.12, [−0.28, 0.52]; p = 0.55; I 2 = 0%; (B) Chao1 index, SMD = −0.34, [−0.62, −0.06]; p < 0.05; I 2 = 36%; (C) Shannon index, SMD = −0.16, [−0.64, 0.31]; p = 0.50; I 2 = 53%; (D) Simpson index, SMD = 0.27, [−0.08, 0.61]; p = 0.13; I 2 = 0%. IMN, idiopathic membranous nephropathy; HCs, healthy controls.

