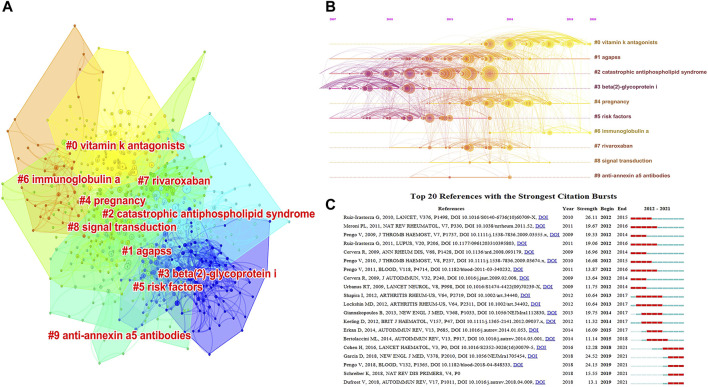
FIGURE 5.
(A) Ten clustering maps of reference co-citation analysis based on CiteSpace. Each cluster is represented by a different color, and the smaller the number label, the larger the cluster profile and the more co-cited references (dots) it contains. (B) Timeline view map of reference co-citation analysis generated by CiteSpace. The elements on the horizontal axis represent co-cited references; the position of the element on the horizontal axis denotes the time of the first occurrence; and the line connecting the elements denotes the co-cited relationship. The size of the element is proportional to the citation count of the reference. A more yellow color indicates closer to the year 2021, and a more red color indicates closer to the year 2012. (C) Top 20 references with the strongest citation bursts by CiteSpace. Each rectangle represents a year. Green rectangles indicate the time interval, and red rectangles indicate the duration of the burst from the beginning to the end.

