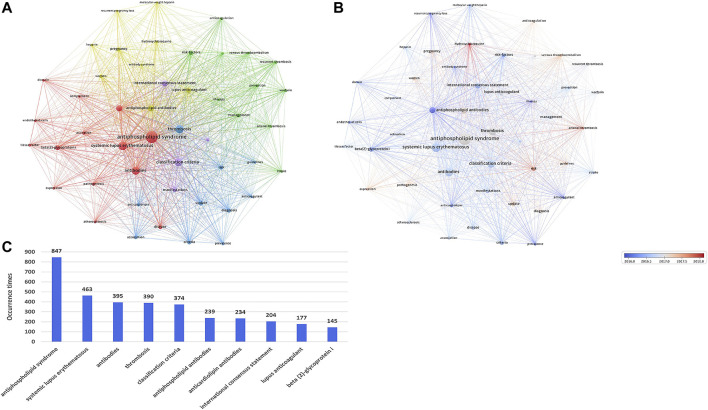
FIGURE 6.
(A) Network clustering map of keywords’ co-occurrence analysis based on VOSviewer. The minimum threshold for the number of keyword frequencies is 40. Keywords were divided into 5 clusters: cluster 1 (red), cluster 2 (green), cluster 3 (blue), cluster 4 (yellow), and cluster 5 (purple). Each keyword is represented as a node, and the node size is proportional to the frequency. The line between nodes denotes a co-occurrence relationship. The distance between nodes denotes the degree of relevancy, and the closer the distance, the higher the degree of relevancy. (B) Overlay map of keywords’ co-occurrence analysis based on VOSviewer. The node color denotes the corresponding average occurrence time according to the color gradient in the lower right corner. Nodes displayed in blue represent keywords that appear relatively early, while nodes displayed in red represent keywords that appear later. (C) Top 20 keywords with the highest occurrence times.

