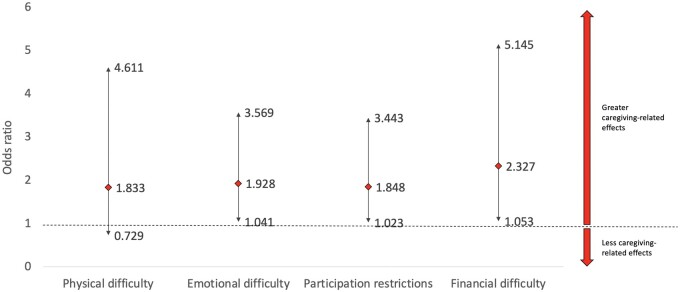
Figure 1.
Forest plot depicting the logistic regression results for the association between working-for-pay and caregiving-related effects. The dotted lines represent the odds ratio base reference of 1; the diamond represents the odds ratio; the downward arrow represents the lower bound of the 95% confidence interval; the upward arrow represents the upper bound of the 95% confidence interval.

