
Figure 2. Cell type-specific A/B compartments and their relations to gene expression and regulatory chromatin.
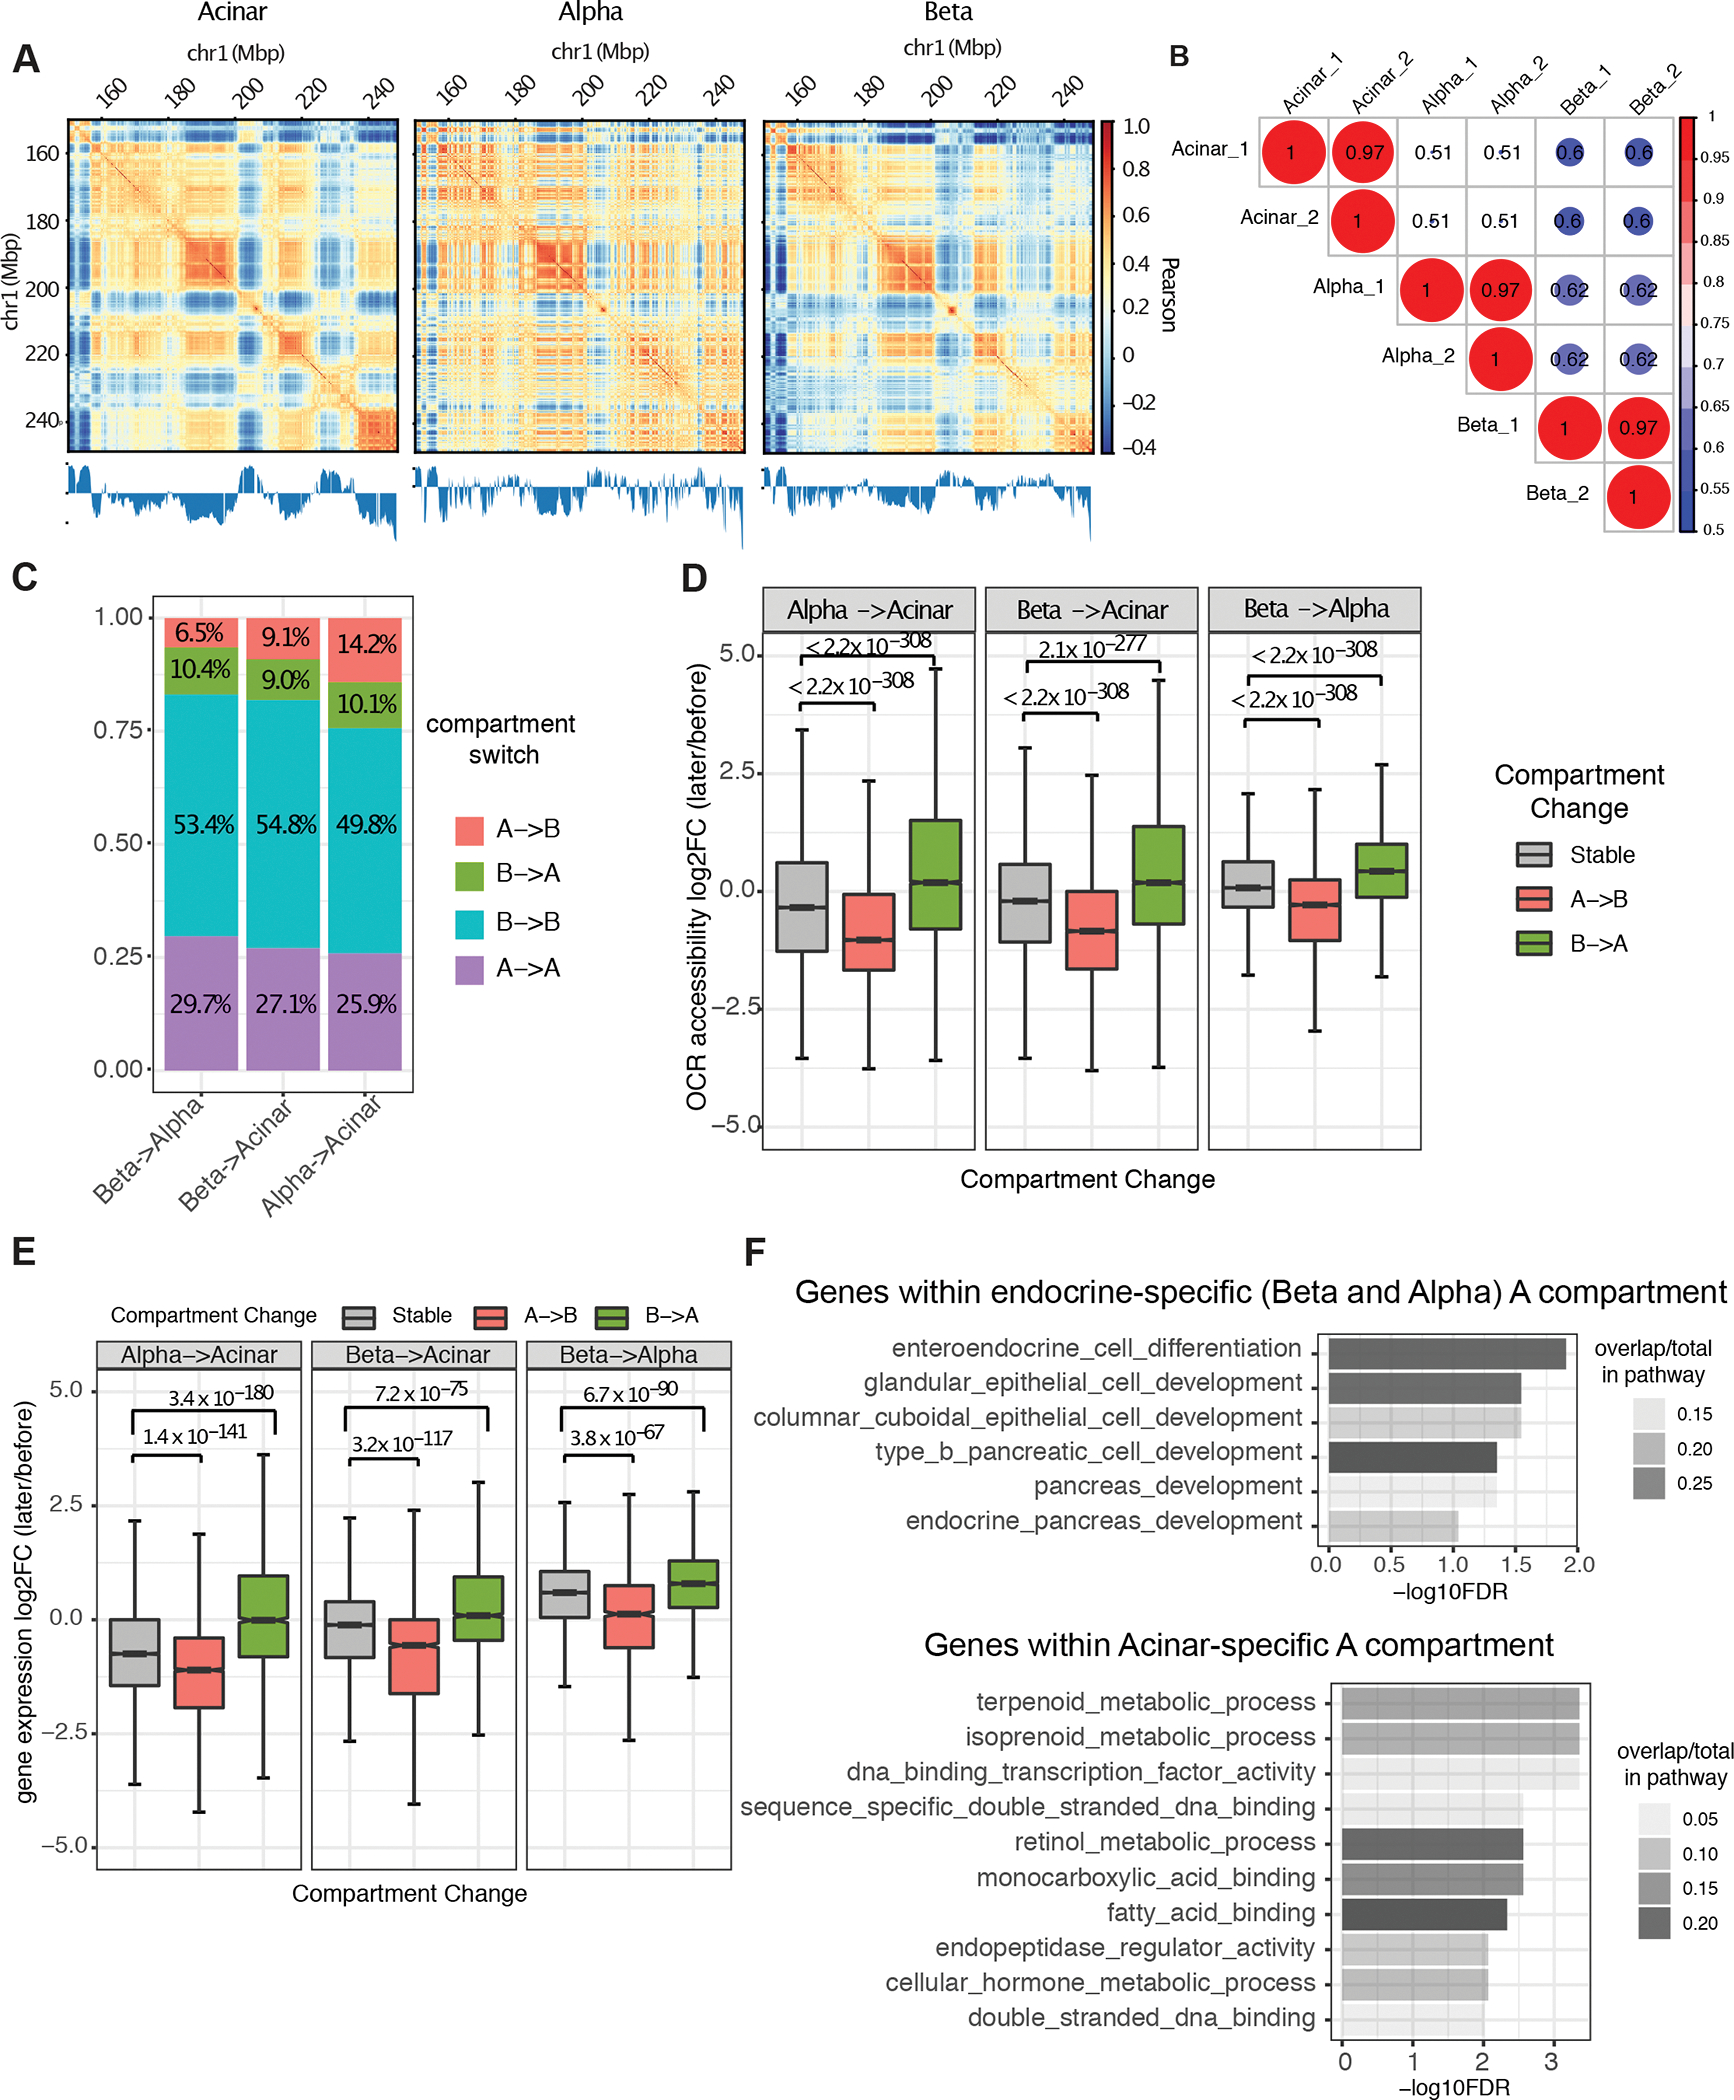
A, Example of A/B compartment identification using Pearson correlation matrix at 40kb resolution on chr1:150,000,000–250,000,000. The plaid pattern suggests that chromatin spatially segregates into two compartments. The first eigenvector of the correlation matrix is shown below to derive compartment type, with genomic GC content as reference. B, Jaccard coefficient of A/B compartment assignment in pairwise comparison of each replicate sample derived from acinar, alpha, and beta cells. A/B compartment assignment was defined by the sign of first eigenvector for each 40kb bin and compared between Hi-C samples. C, Composition of genomic regions that change compartment status or remain the same in pairwise comparisons between cell-types. D and E, Distribution of fold-change in OCR (open chromatin region) accessibility (D) and gene expression (E) at dynamic (A to B or B to A) or stable (A to A or B to B) compartmentalized regions. P value was calculated by two-sided Wilcoxon sum rank test; whiskers correspond to interquartile range. F, Pathway enrichment for genes located at endocrine and acinar-specific A compartment. P-values are calculated by hypergeometric test with FDR correction.