
Figure 4. Cell-type specific transcription factor (TF) motif enrichment and TF-gene network.
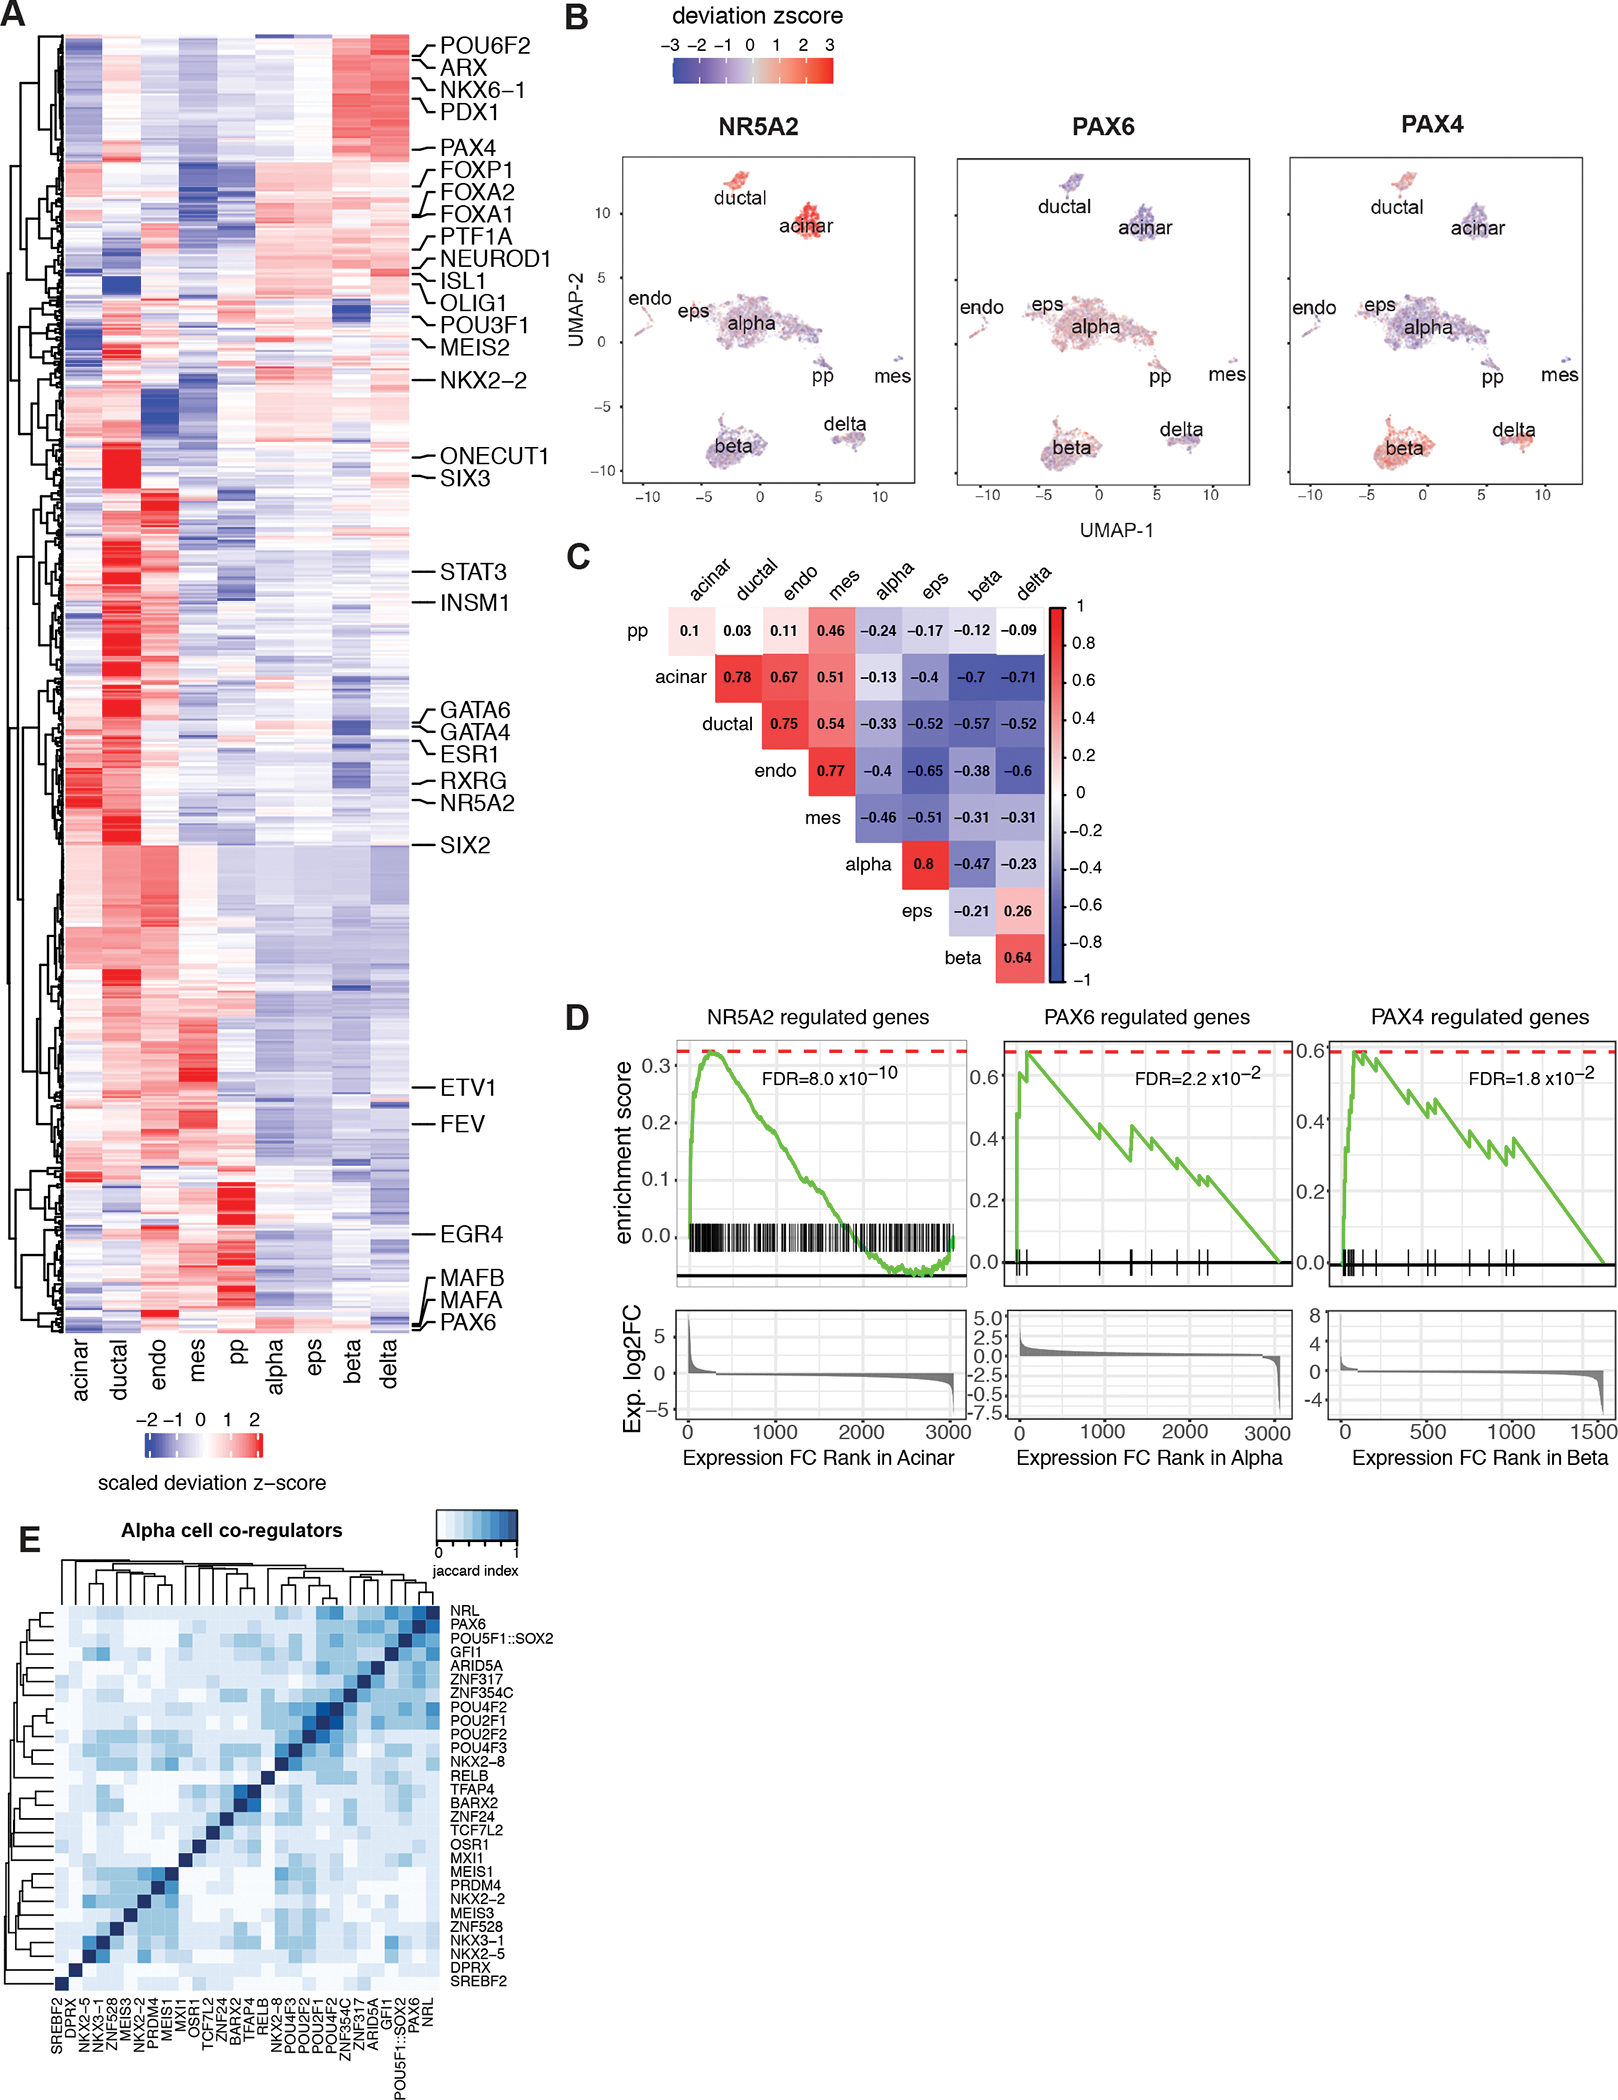
A, chromVAR motif enrichment for 438 cell-type-specific TFs. The identification of cell-type-specific TFs is explained in Methods, for full list see Supplemental Table 6. The enrichment was measured by deviation z-score. B, The enrichment for NR5A2, PAX6 and PAX4 motifs for each cell projected onto UMAP. C, Pearson correlation of TF enrichment between cell types. The deviation z-score was used for correlation. D, GSEA pre-rank enrichment of cell type-specific expressed genes identified as NR5A2, PAX6 and PAX4 downstream genes by motif analysis. Genes are ranked by gene expression log2 fold change in the given cell type from highest to the lowest. Gene sets are defined by TF downstream genes of which either promoters or distal cis-regulatory elements contain the given TF motif. Details of enrichment are given in Supplemental Table 7. E, Association index analysis reveals alpha-specific TF modules. TF sets are defined cell-specific TFs with significant GSEA enrichment (Supplemental Table 7). Matrices show the Jaccard similarity between TF pairs based on occurrence of co-regulated downstream gene.