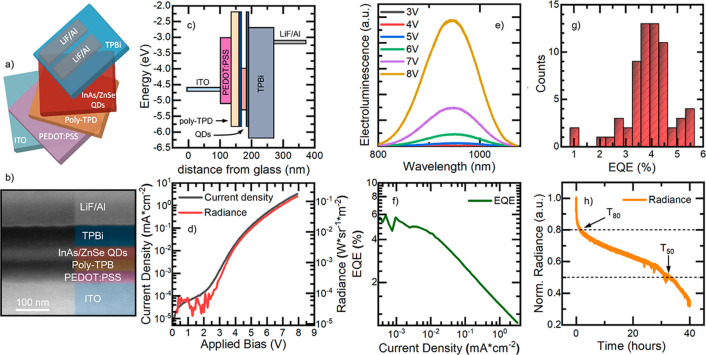
Figure 1.
(a) Schematic, (b) SEM cross-sectional image, (c) flat energy-level diagram as a function of the device thickness, (d) current density (gray solid curve) and radiance (red solid curve) versus applied bias, (e) EL spectra at increasing applied bias, (f) EQE vs current density, (g) histogram of the EQEs of 64 pixels, and (h) stability test of the champion NIR LED.

