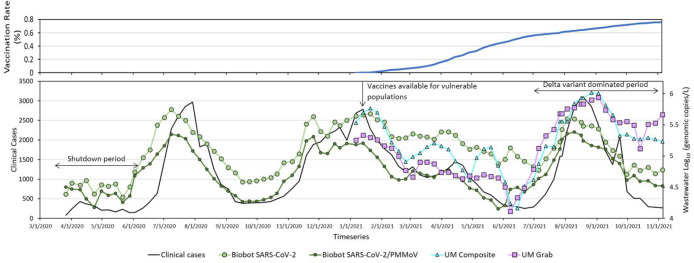
Figure 2.
Miami-Dade County full (two shots) vaccination rate (top smaller panel) and case data (7-day moving average shown by heavy black line). Three-day moving average wastewater data shown on bottom panel, including WASD raw SARS-CoV-2 RNA concentrations, WASD normalized SARS-CoV-2 RNA concentrations, and UM raw SARS-CoV-2 RNA concentrations for composite and grab samples. WASD data corresponds to weighted average SARS-CoV-2 for measurements taken at all three wastewater treatment plants, whereas the UM SARS-CoV-2 corresponds to measurements taken at the CDWWTP only.

