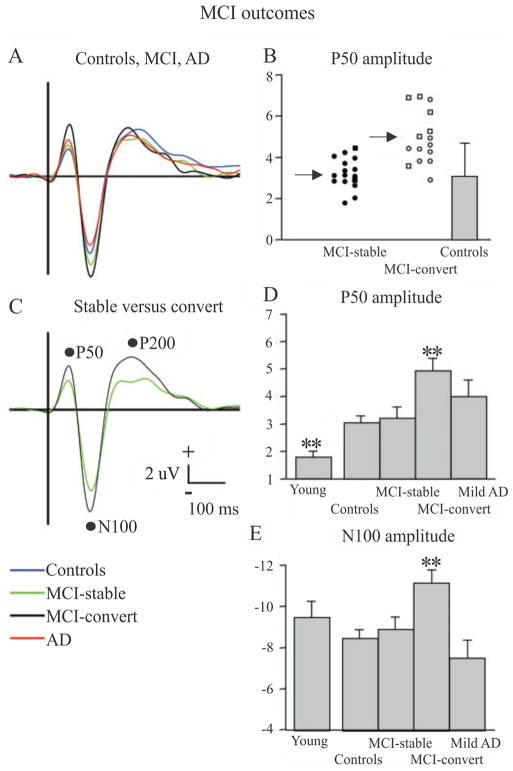
Fig. 2.
ERPs in response to 1000 Hz tones (“non-targets”, presented with a probability of 0.8) across five groups: young controls, aged controls, MCI-stable (do not convert to AD at up to 5 year follow-up), MCI-convert (convert to AD at up to 5 year follow-up) and AD. A) ERP waveforms for all four groups and C) for MCI-stable versus MCI-convert. B, D, E) Plots of average P50 [B and D] and N100 [E] across the different groups (**p < 0.01). In [B], circle = MCI-single domain and square = MCI-multiple domain. Error bars = standard deviation.
Reproduced with permission from Golob et al., 2007.

