Figure 1.
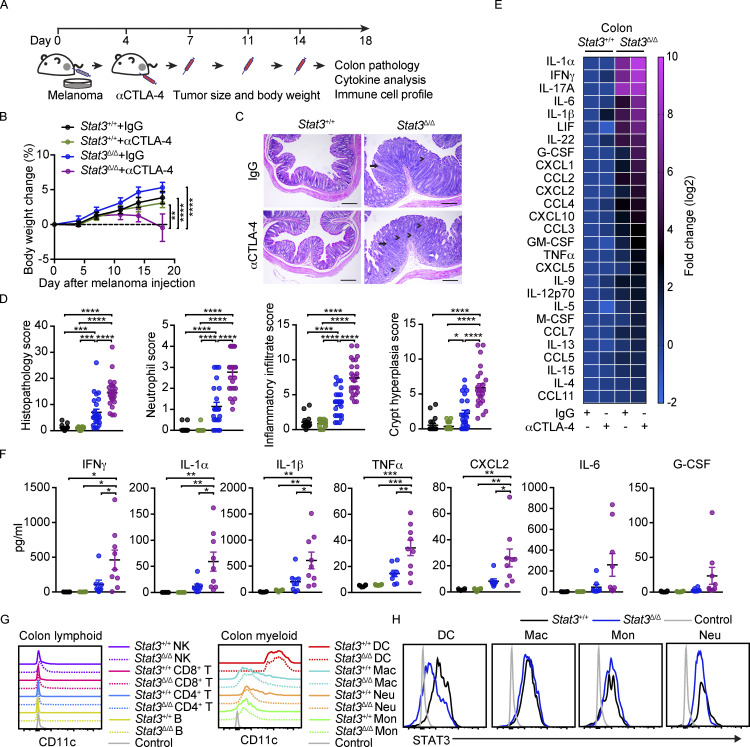
αCTLA-4–mediated intestinal toxicity in inflammation-prone mice. Stat3Δ/Δ and Stat3+/+ mice bearing B16-OVA tumors were treated biweekly for 2 wk with IgG or αCTLA-4 beginning 4 d after tumor establishment, as indicated. Body weight was measured over time. Colon pathology was evaluated 18–19 d following tumor establishment. (A) Schematic diagram of the experimental approach. (B) Body weight over time; n = 21 per group. (C) Representative photomicrographs of colonic mucosa; intense inflammatory infiltrate in the LP (arrowheads) and crypt hyperplasia (arrow) are indicated; scale bar = 100 microns; H&E. (D) Summed scores for histopathology, neutrophil infiltrate, mixed inflammatory cell infiltrate, and crypt hyperplasia are shown; n = 18–24 per group. (E) Mean concentration of differentially expressed cytokines and chemokines in colon tissue (fold change absolute log2 > 1), determined by multiplex assays. Results were normalized to Stat3+/+ + IgG group and transformed to log2; n = 6–9 per group. (F) Cytokine concentration in colon tissues from individual mice (each mouse represented by one dot) determined by multiplex assays; n = 6–9 per group. (G) CD11c expression on colonic LP immune cells. (H) Intracellular staining of STAT3 in colonic LP myeloid cells. Data shown as mean ± SEM. Results from two to five independent experiments. Data were analyzed by two-way ANOVA (B), one-way ANOVA (D and F). * P < 0.05, ** P < 0.01, *** P < 0.001, **** P < 0.0001.

