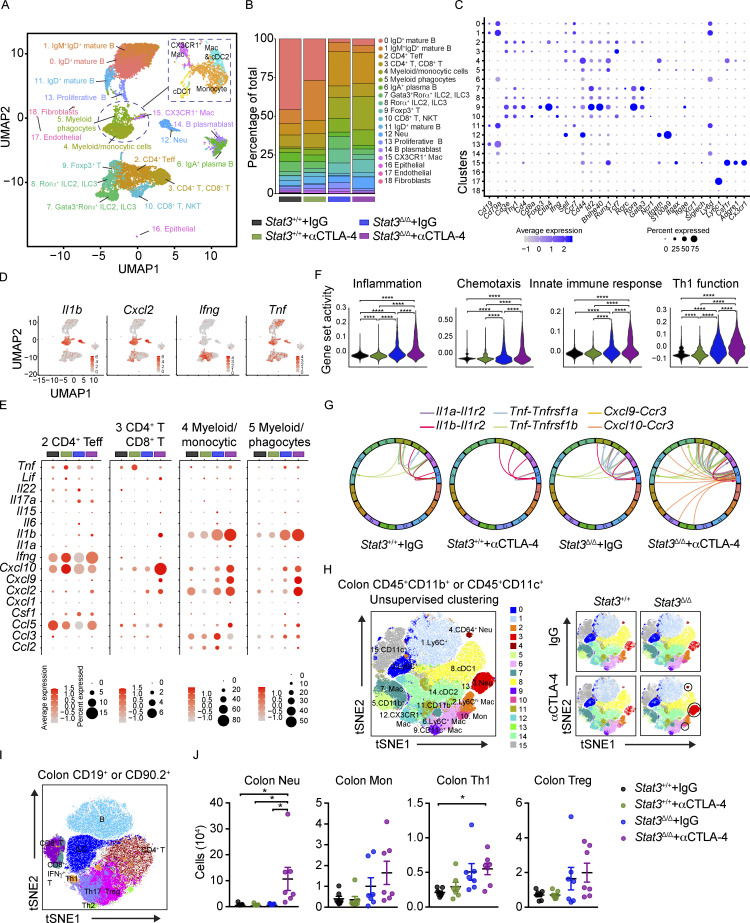
Figure 2.
αCTLA-4 therapy remodels the intestinal immune landscape in inflammation-prone conditions. Stat3Δ/Δ and Stat3+/+ mice bearing B16-OVA tumors were treated biweekly for 2 wk with IgG or αCTLA-4. Colonic LP immune cells (live CD45+ cells) were isolated by FACS 18–19 d after tumor establishment and completion of therapy. (A–G) Colonic LP immune cells were subjected to scRNAseq. (A) UMAP plot showing distinct clusters generated from a merged dataset of the four experimental groups, based on transcriptomic analysis of 14,039 individual cells. Results represent 4,461 cells from the Stat3+/+ + IgG group, 4,734 cells from the Stat3+/+ + αCTLA-4 group, 1,341 cells from the Stat3Δ/Δ + IgG group, and 3,503 cells from the Stat3Δ/Δ + αCTLA-4 group; from seven to eight mice per group. Dimensionality reduction analysis identified 16 major immune clusters and three minor nonimmune clusters. (B) Proportion of individual clusters in each experimental group. (C) Dot plots of selected cluster-defining genes. (D) Feature plots of combined groups depicting single-cell mRNA expression of proinflammatory factors. (E) Dot plots showing differentially expressed cytokines and chemokines in T cell and myeloid clusters among experimental groups. (F) Expression module scores of Gene Ontology terms (inflammation, chemotaxis, innate immune response, and Th1 function) computed for the aggregated dataset of individual experimental groups. (G) Analysis of cytokine and chemokine receptor–ligand pairs across clusters of each experimental group. All shown interactions were statistically significant based on a permutation test. Arrows denote directionality from ligand to receptor. (H–J) Colonic LP immune cells were analyzed by multiparameter flow cytometry. (H) tSNE plots showing unsupervised analyses of merged live myeloid cells (CD11b+ or CD11c+) from the four experimental groups (left); tSNE plots of aggregated myeloid cells of individual experimental groups (right); n = 7 in each group. (I) tSNE plot showing prospective analyses of merged live lymphoid cells (CD90.2+ or CD19+) from colonic LP from the four experimental groups; n = 7 per group. (J) Absolute counts of neutrophils, monocytes, Th1, and Treg cells in colonic LP; n = 7 per group. Data shown as mean ± SEM. (H–J) Results from two independent experiments. Data were analyzed by one-way ANOVA (F and J). * P < 0.05, **** P < 0.0001.

