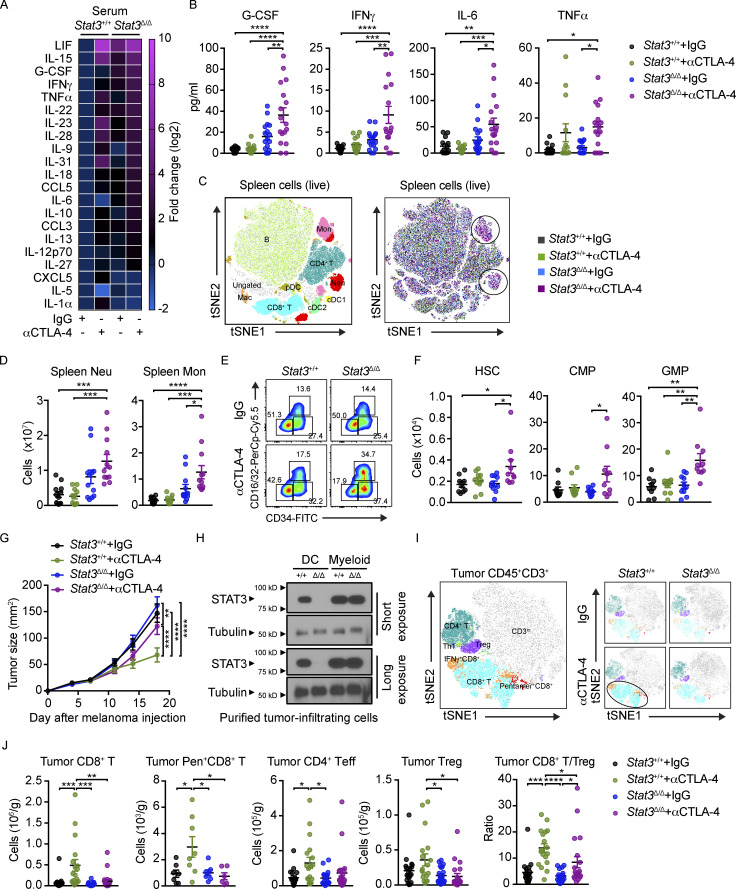
Figure 3.
Systemic cytokine release and myelopoiesis with αCTLA-4 therapy in inflammation-prone conditions. Stat3Δ/Δ and Stat3+/+ mice with B16-OVA tumors were treated biweekly for 2 wk with IgG or αCTLA-4. Serum cytokines and spleen and BM immune cells were analyzed 18–19 d after tumor establishment and completion of therapy. (A) Mean concentration of differently expressed cytokines in serum, determined by multiplex assays, fold change absolute log2 > 1; n = 13–17 per group. (B) Serum cytokines from individual mice analyzed by multiplex assays; n = 13–17 per group. (C) tSNE plot showing prospective clustering of live spleen cells merged from the four experimental groups (left); distribution of spleen immune cells, colored based on experimental groups (right); n = 6–7 in each group. (D) Neutrophil and monocyte amounts in spleen; n = 11–12 per group. (E) Representative flow plots showing CD34+ CD16/32− CMPs, CD34+ CD16/32+ GMPs, and CD34− CD16/32− MEPs (megakaryocyte-erythroid progenitors) gated from the lin− Sca-1− CD117+ population. (F) Absolute amounts of HSCs, CMPs, GMPs in each experimental group; n = 9–10 per group. (G) Tumor size over time; n = 24–30 per group. (H) STAT3 expression in tumor-infiltrating DCs (CD11c+) or myeloid cells (CD11b+ CD11c−) determined by immunoblotting. The filter was cut horizontally to separate differentially sized proteins and probed with antibodies to STAT3 or tubulin. The filters were reassembled according to the original gel orientation for each exposure time. (I) tSNE plots showing merged CD45+ CD3+ cells from the four experimental groups (left), and tSNE plots of aggregated CD45+ CD3+ cells of individual experimental groups (right); n = 6–8 per group. (J) Number of tumor-infiltrating CD8+ T cells, OVA-specific SIINFEKL/H-2Kb pentamer+ CD8+ T cells, CD4+ Foxp3− Teff cells, CD4+ Foxp3+ Treg, and CD8+/Treg ratios. For SIINFEKL/H-2Kb pentamer+ CD8+ T cells, n = 6–8 per group; for other plots, n = 18–21 per group. Data shown as mean ± SEM. Results from two to five independent experiments. Data were analyzed by one-way ANOVA (B, D, F, and J) or two-way ANOVA (G). * P < 0.05, ** P < 0.01, *** P < 0.001, **** P < 0.0001. Source data are available for this figure: SourceData F3.

