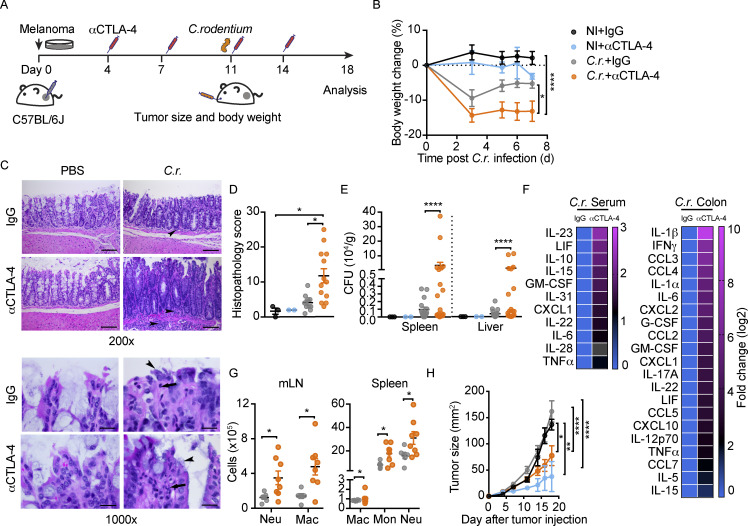
Figure 6.
Disruption of gut homeostasis by acute intestinal infection associates with αCTLA-4–induced toxicity. C57BL/6J mice with B16-OVA tumors were treated biweekly for 2 wk with IgG or αCTLA-4. Mice were infected with 4–6 × 10⁹ C. rodentium on day 11 by oral gavage (C.r.) or remained uninfected (NI). Animals were euthanized 18 d after tumor establishment and completion of therapy. (A) Schematic diagram of experiment. (B) Body weight change over time; n = 2–5 per NI group, n = 11–12 per C.r. group. (C) Representative photomicrographs of proximal colonic mucosa. Note the intense inflammatory infiltrate in the LP (arrowheads), scale bar = 100 microns (upper panels); and neutrophil infiltrate (arrow) and C. rodentium load on colonic epithelium (arrowheads), scale bar = 20 microns (lower panels); H&E. (D) Histopathological scores of proximal colon at the experimental endpoint; n = 2–3 per NI group, n = 11–13 per C.r. group. (E) CFUs in spleen and liver as indicated; n = 2–3 per NI group, n = 16–20 per C.r. group. (F) Differential cytokine amounts in colon tissue (n = 2 per group) and serum (n = 10 for C.r. + IgG group, n = 11 for C.r. + αCTLA-4 group) as indicated, fold change absolute log 2 > 1. (G) Absolute amounts of immune cells in mLN and spleen as indicated; n = 6–8 per group. (H) Tumor size over time; n = 2–3 per NI group, n = 9–11 per C.r. group. Data shown as mean ± SEM, from four independent experiments. Data were analyzed by two-way ANOVA (B and H), one-way ANOVA (D), F test to compare variations (E), and two-tailed unpaired Student’s t test (G). * P < 0.05, ** P < 0.01, **** P < 0.0001.

