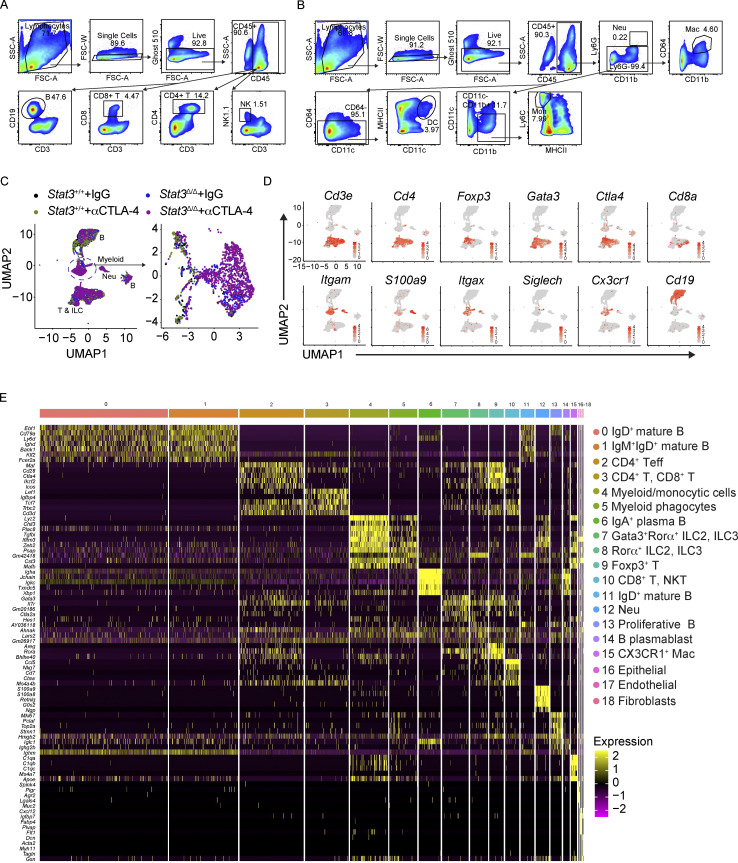
Figure S1.
Flow cytometry gating strategy for colonic LP immune cells and scRNAseq analysis of colonic LP immune cells following αCTLA-4 therapy. (A) Gating strategy of colonic LP lymphoid cell subsets. (B) Gating strategy of colonic LP myeloid cell subsets. (C–E) Stat3Δ/Δ and Stat3+/+ mice bearing B16-OVA tumors were treated biweekly for 2 wk with IgG or αCTLA-4. Colonic LP immune cells were subjected to scRNAseq as indicated in Fig. 2; n = 7–8 per group. (C) Distinct composition of colonic LP immune cell populations in mice of indicated genotypes and treatments (left), with expanded view of myeloid clusters (right). (D) Feature plots of selected cluster-defining genes. (E) Heatmap of the top five differentially expressed genes in each cluster.

