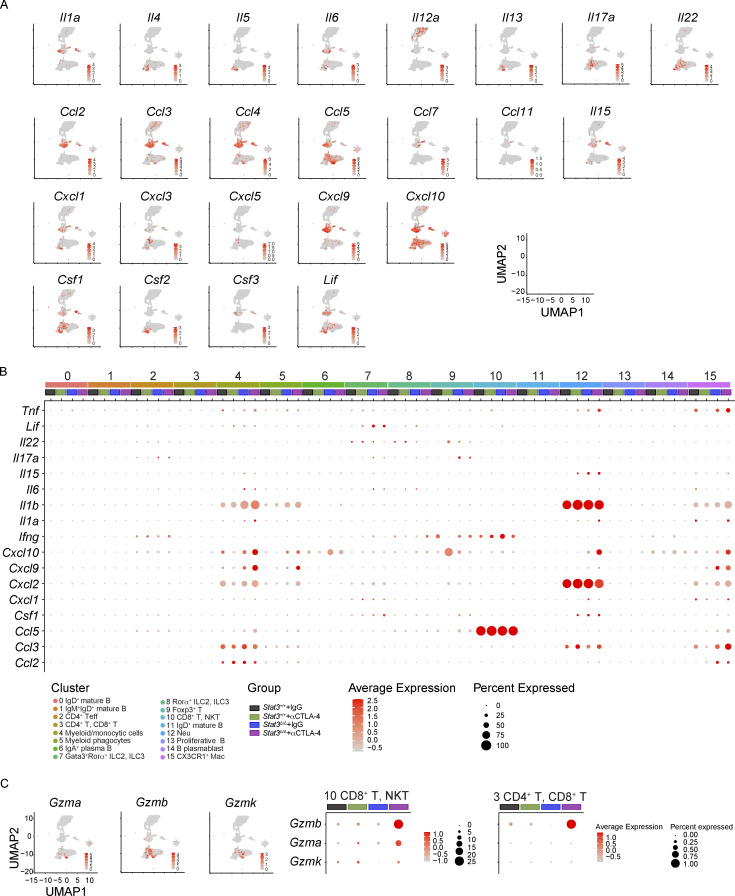
Figure S2.
Expression of pro-inflammatory factor mRNAs in colonic LP immune cells from mice on αCTLA-4 therapy. Colonic LP immune cells were subjected to scRNAseq as indicated in Fig. 2; n = 7–8 per group. (A) Feature plots of combined groups depicting single-cell mRNA expression of pro-inflammatory factors. (B) Dot plots showing differentially expressed cytokines across clusters and treatment groups. (C) Cytotoxic gene signature in T cells across different treatment groups.

