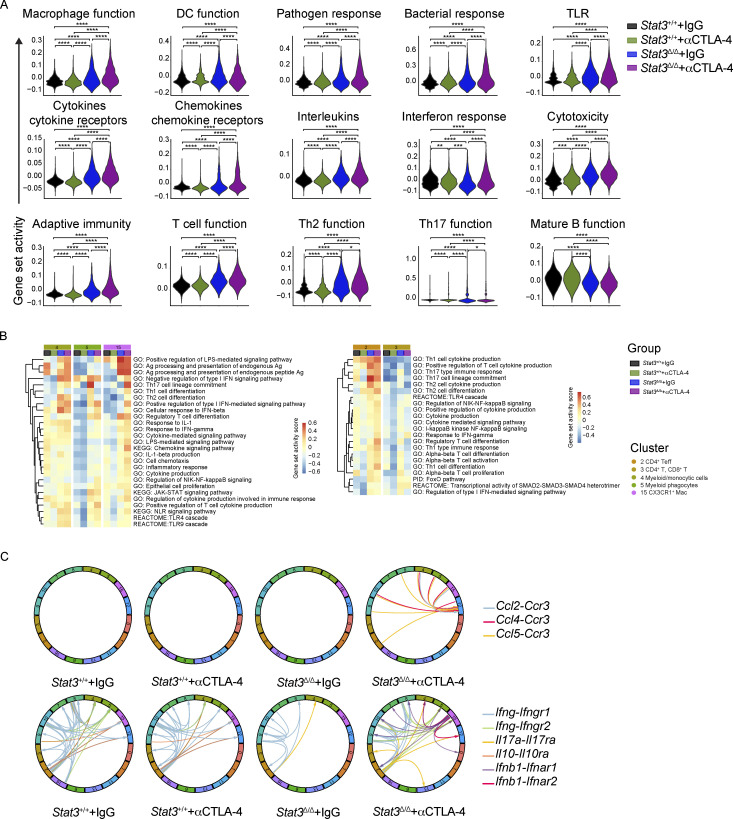
Figure S3.
Pathway analysis of colonic LP immune cells from mice on αCTLA-4 therapy. Colonic LP immune cells were subjected to scRNAseq as indicated in Fig. 2; n = 7–8 per group. (A) Expression module scores of Gene Ontology (GO) terms, computed for the aggregated dataset of individual groups. (B) Gene set activation score of myeloid (left) and T (right) cells in each experimental group computed by GSVA. (C) Analysis of cytokine and chemokine receptor–ligand pairs across clusters of each experimental group. All shown interactions were statistically significant based on a permutation test (Table S3). Arrows denote directionality from ligand to receptor.

