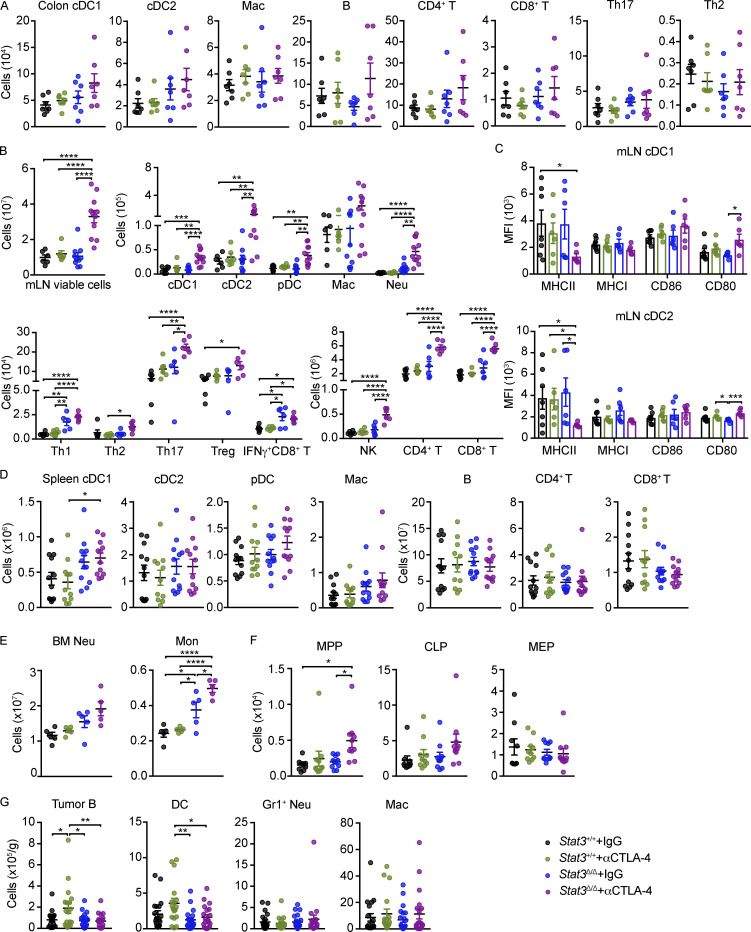
Figure S4.
Characterization of immune responses in mice on αCTLA-4 therapy. Stat3Δ/Δ and Stat3+/+ mice with B16-OVA tumors were treated biweekly for 2 wk with IgG or αCTLA-4. (A) Absolute numbers of colonic LP immune subsets; n = 7 per group. (B) Absolute numbers of mLN immune cell populations. For plots of viable cells and myeloid cells, n = 5–11 per group. For plots of lymphoid cells, n = 5–6 per group. (C) Mean fluorescence intensity (MFI) of MHC and co-stimulatory molecules on mLN DCs; n = 6–7 per group. (D) Absolute numbers of splenic immune cells; n = 11–12 per group. (E) Absolute numbers of neutrophils and monocytes in BM; n = 5 per group. (F) Absolute numbers of MPPs (multipotent progenitors), CLPs (common lymphoid progenitors) and MEPs (megakaryocyte-erythroid progenitors) in BM; n = 9–10 per group. (G) Absolute number of tumor-infiltrating B cells, DCs, neutrophils, and macrophages; n = 18–21 per group. Data shown as mean ± SEM. Results from two to five independent experiments. Data were analyzed by one-way ANOVA (D, F, and G). * P < 0.05, ** P < 0.01, *** P < 0.001, **** P < 0.0001.

