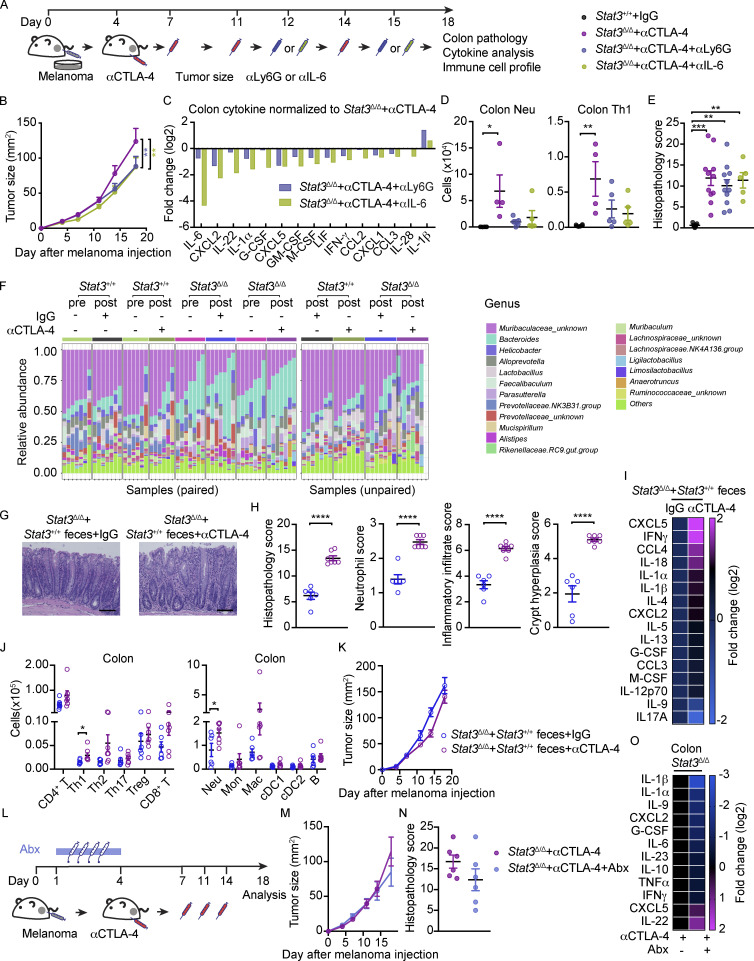
Figure S5.
Effects of neutrophil depletion, IL-6 blockade, antibiotics, or FMT from WT mice on αCTLA-4–associated toxicity. (A–E) Stat3Δ/Δ mice with B16-OVA tumors were treated biweekly for 2 wk with IgG or αCTLA-4; Ly6G or IL-6 antibodies (αLy6G or αIL-6, respectively) were injected 12 and 15 d after tumor establishment. Colon cytokines and immune subsets were analyzed 18 d after tumor establishment and completion of therapy. (A) Schematic diagram of experiment. (B) Tumor growth over time; n = 11–17 per group. (C) Differentially expressed cytokines in colon (i.e., cytokines with fold change <0.7 or >1.4); expression normalized to mean concentration in αCTLA-4–treated Stat3Δ/Δ mice; n = 8–14 per group. (D) Neutrophil and Th1 cell numbers in colonic LP; n = 4–6 per group. (E) Histopathology score; n = 5–11 per group. (F) Stat3Δ/Δ and Stat3+/+ mice with B16-OVA tumors were treated biweekly for 2 wk with IgG or αCTLA-4. Fecal samples were collected prior to (3 d) and following αCTLA-4 treatment (18 d); microbiome composition was characterized by 16S rRNA gene profiling, as described in Fig. 4. Composition plots representing relative abundance of microbial taxa (obtained from 16S rRNA gene profiling of the fecal samples) at the genus level. (G–K) Recipient Stat3Δ/Δ mice were given fecal transplantation from donor Stat3+/+ mice. Recipient Stat3Δ/Δ mice were injected with B16-OVA cells and treated with αCTLA-4 or IgG i.p. biweekly for 2 wk. Organ samples were collected 18 d after melanoma injection. (G) Representative photomicrographs of colonic mucosa, scale bar = 100 microns; H&E. (H) Summed scores for histopathology, neutrophil infiltrate, mixed inflammatory cell infiltrate, and crypt hyperplasia are shown; n = 6–7 per group. (I) Differentially expressed cytokines in colon (i.e., cytokines with fold change <0.7 or >1.4); n = 6–7 per group. (J) Absolute amounts of immune cells in colonic LP; n = 6–7 per group. (K) Tumor size over time; n = 6–7 per group. (L–O) Stat3Δ/Δ mice with B16-OVA tumors were treated biweekly for 2 wk with αCTLA-4. Mice received broad-spectrum antibiotics (metronidazole, ampicillin, vancomycin, and enrofloxacin; Abx) daily for 4 d prior to first αCTLA-4 injection. (L) Schematic diagram of experiment. (M) Tumor size over time; n = 11–16 per group. (N) Histopathology scores; n = 6 for each group. (O) Differentially expressed cytokines from colon (i.e., cytokines with fold change <0.7 or >1.4), normalized to mean concentration in αCTLA-4–treated Stat3Δ/Δ mice; n = 6 for each group. Data shown as mean ± SEM. Results from two to three independent experiments. Data were analyzed by two-way ANOVA (B), one-way ANOVA (D and E), statistical method implemented in the R package DESeq2 (F), two-tailed unpaired Student’s t test (H and J). * P < 0.05, ** P < 0.01, *** P < 0.001, **** P < 0.0001.

