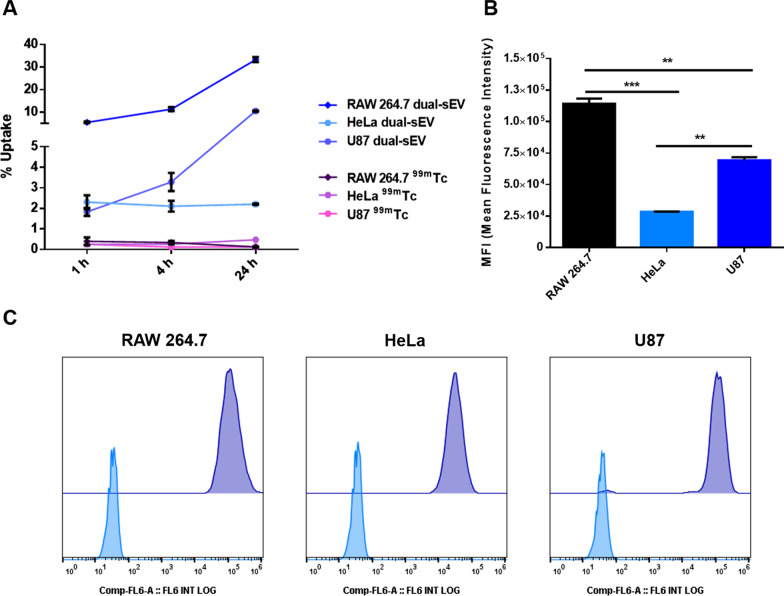
Fig. 4.
In vitro assessment of radioactive and optical uptake of dual-sEVs by gamma counter and flow cytometry. A Radioactive uptake for RAW 264.7, HeLa, and U87 cells after 1 h, 4 h, and 24 h of dose addition. 99mTc was used as a control. Data are represented as mean ± standard deviation (SD). B Median fluorescence intensity (MFI) inside the cells was evaluated at 24 h. * p < 0.05, ** p < 0.01, *** p < 0.001. Data are represented as mean ± SD. C Flow cytometry diagrams of control cells (RAW 264.7, HeLa, and U87 cells, in blue) and treated cells (RAW 264.7, HeLa, and U87 cells, in purple)

