
Fig. 11.
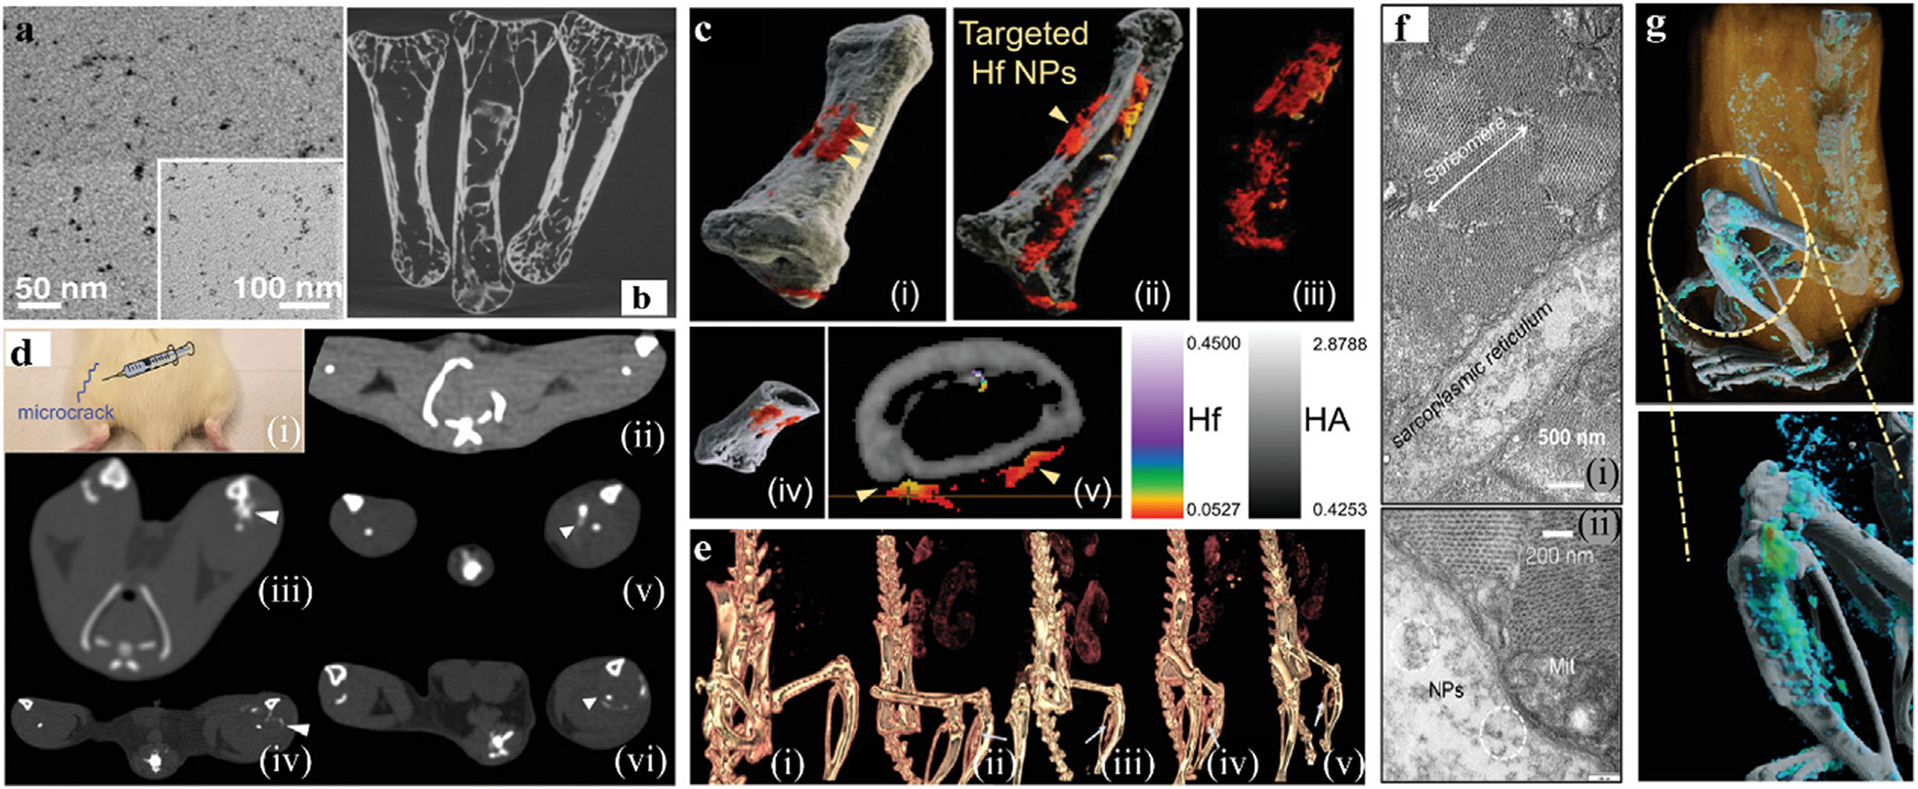
Studies on Hf-based NPs CAs. a) TEM image of HfO2@NTA. b) micro-CT image of injured bone in vitro. c) i-v) The 3D reconstruction spectral CT image of HfNPs targeting injured bone in vitro. d) Rat model of induced bone injury i). Traditional CT images for ii) surgical without injection control group, iii-iv) the non-targeted injection group at 30 min and 5 h, respectively, v-vi) the targeted injection group at 30 min and 5 h, respectively. e) 3D images of ii-vi) in (d). f) TEM image of dissected muscle; (i) and (ii) are identical except for magnification. g) 3D reconstructed spectral CT images of targeted group (high concentration of Hf is marked in cyan-green, low concentration in blue and calcium channel in white) (GE Healthcare). Reproduced from Ref. [132] Copyright 2019, Advanced Functional Materials.