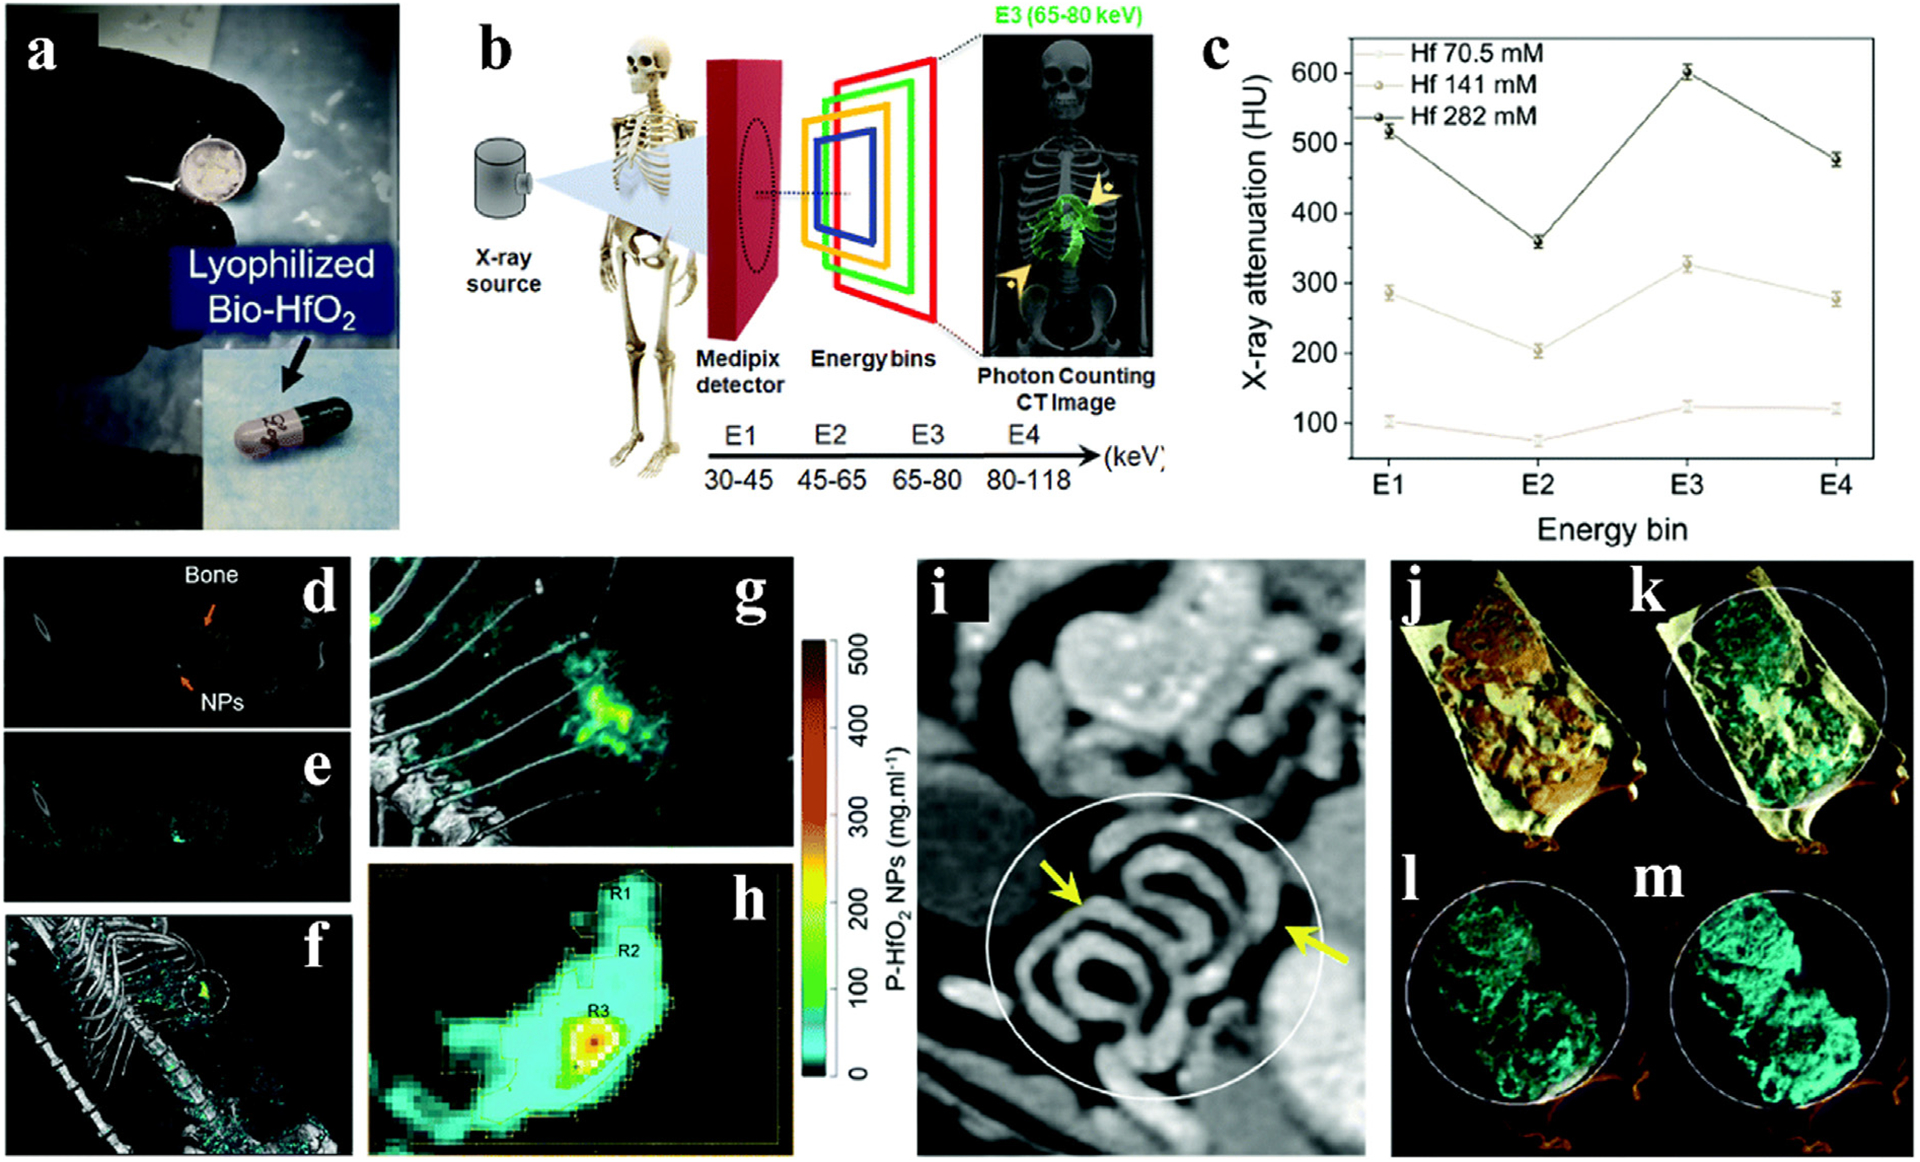
Fig. 12.

GI studies on HfO2 NPs CAs. a) HfO2 and probiotics were freeze dried and packaged in capsules. b) Schematic diagram of photon counting CT work. c) Spectral response graph of HfO2. d) Coronal view of the energy bin in the rat. e) Coronal view of the energy bin overlaid with Hf in the rat. f) 3D reconstructed image of material decomposition. g) and h) Enlarged view of the area circled in f). The concentrations in the R1, R2 and R3 regions range from low to high, respectively. i) Photon-counting CT images of the GI tract without fasting before gavage with Hf capsules. j-m) Partial enlarged view of the lining of the GI tract in i). Soft tissue (orange), lipid (yellow), HA (gray) and HfO2 NPs (cyan) (small-bore MARS spectral CT scanner). Reproduced from Ref. [133] Copyright 2022, Nanoscale Horizons.
