
Fig. 15.
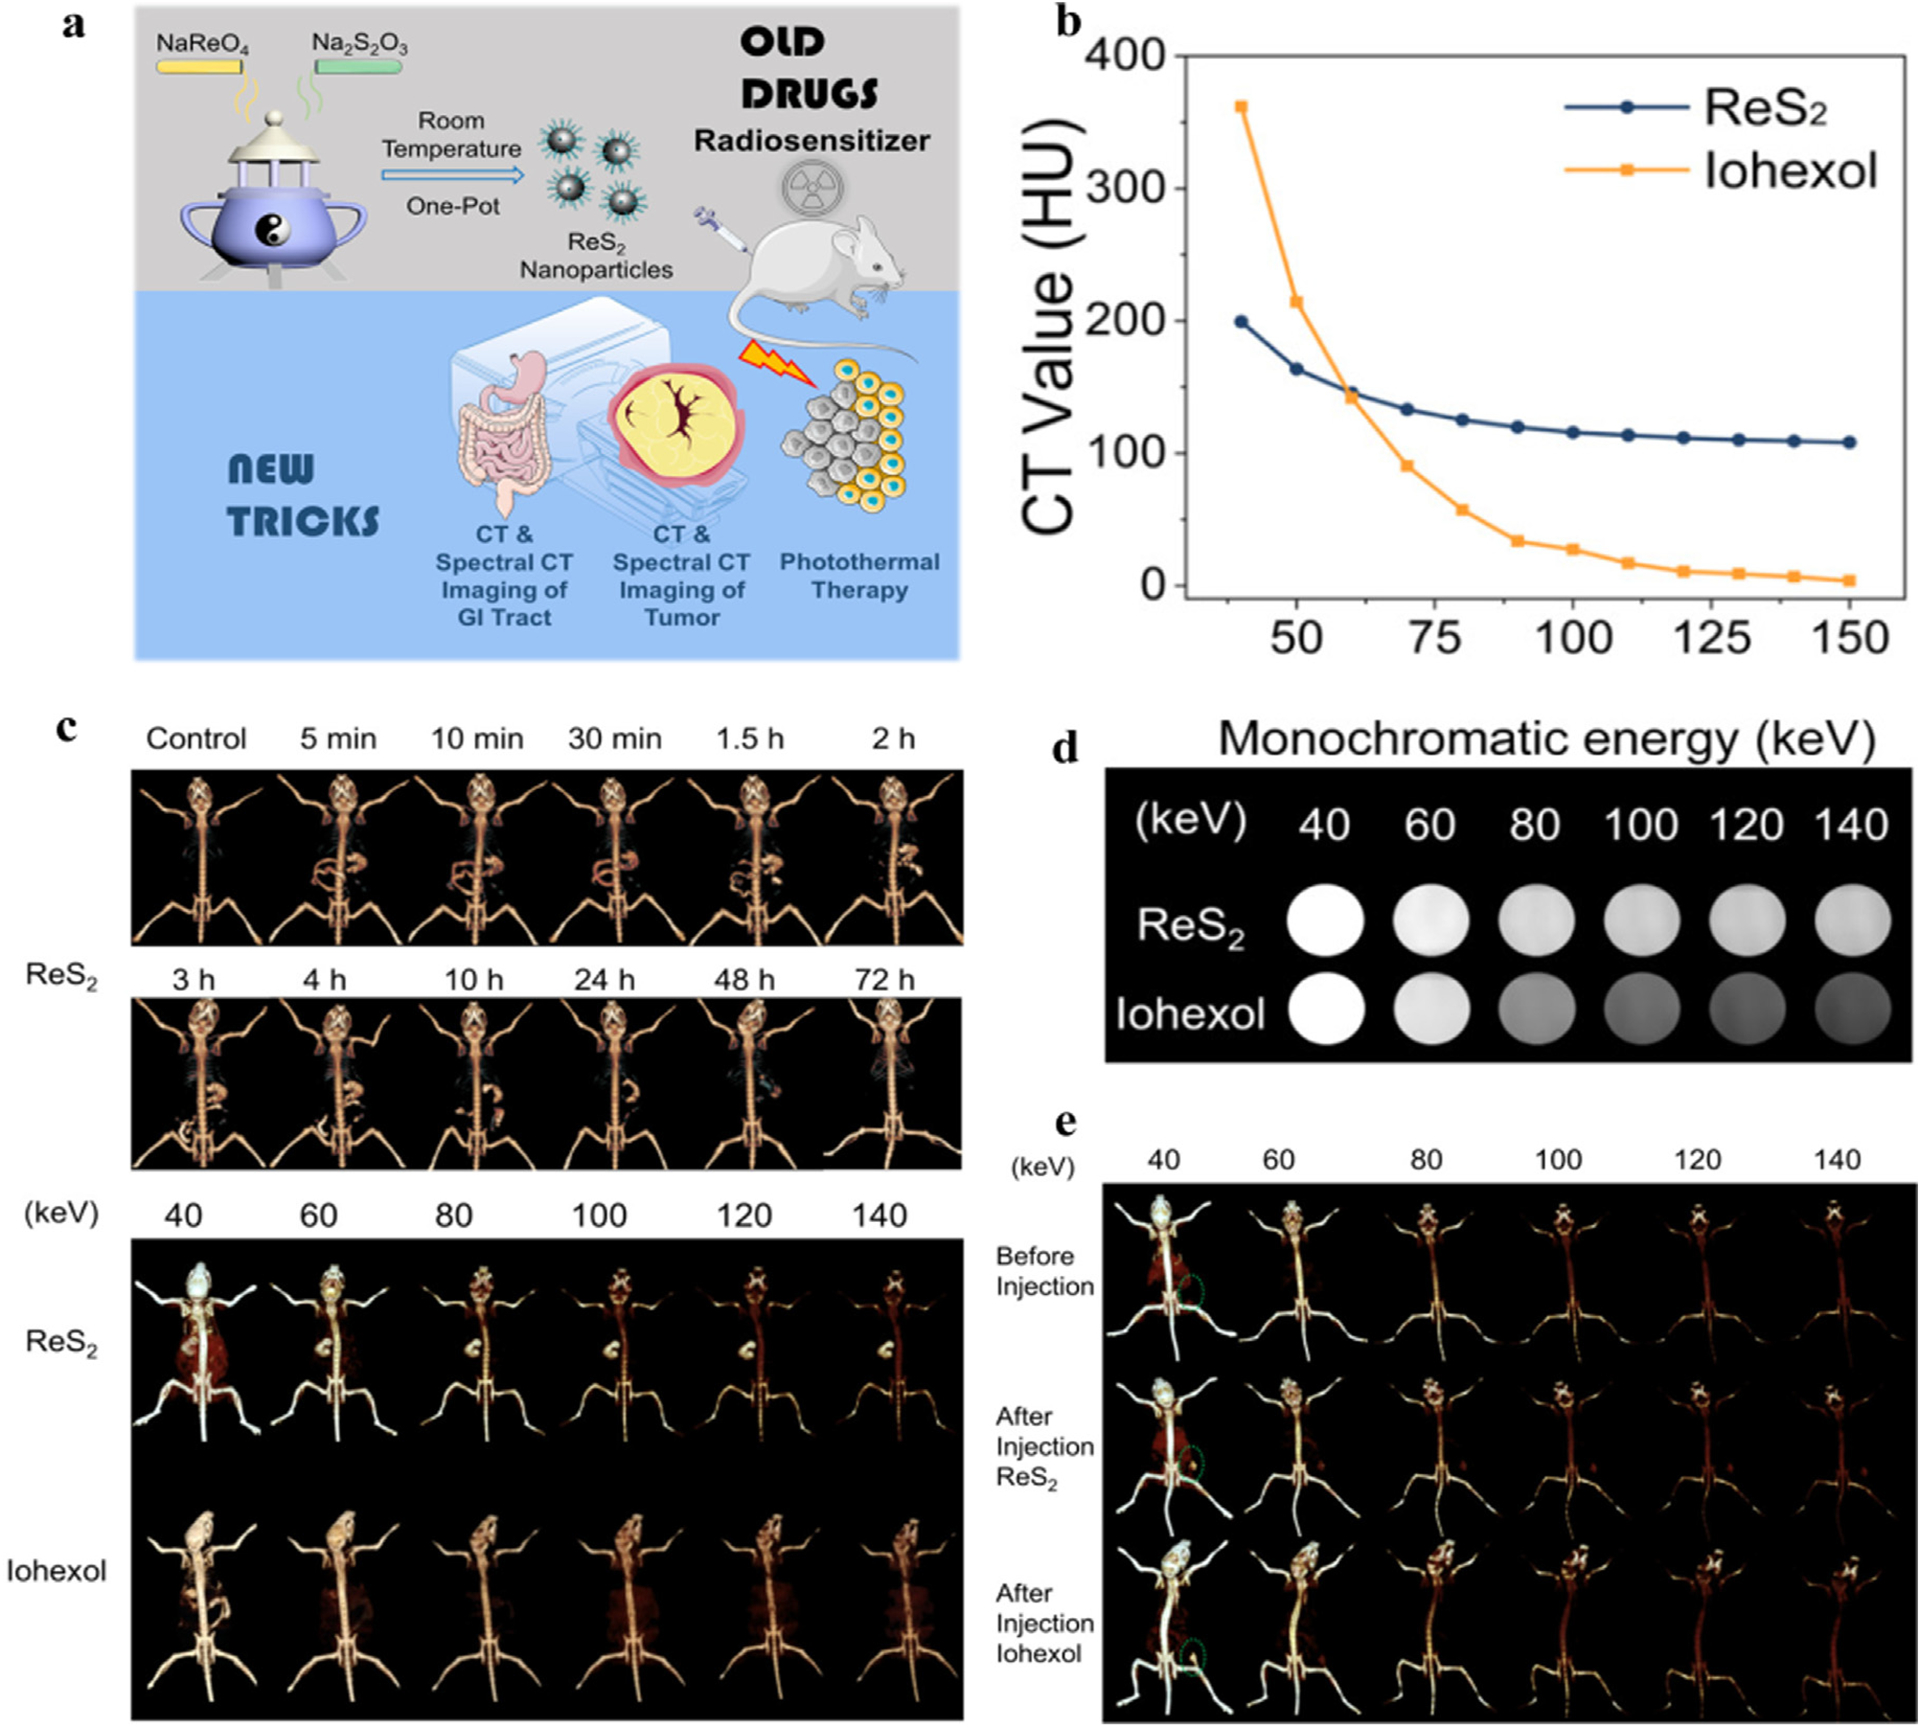
Studies on Re-based NPs CAs. a) Schematic representation of ReS2 NPs. b) The X-ray attenuation curve of ReS2 and iohexol. c) The spectral CT image of the GI system at different times after oral administration of ReS2 (above) and different keV image after oral administration of ReS2 and iohexol at 5 min (below). d) Gray spectral CT image of ReS2 and iohexol at different keV. e) The spectral CT image at different keV before and after intratumoral injection of ReS2 and iohexol in vivo (Siemens Healthcare). Reproduced from Ref. [143] Copyright 2019, ACS Applied Materials & Interfaces.