
Fig. 4.
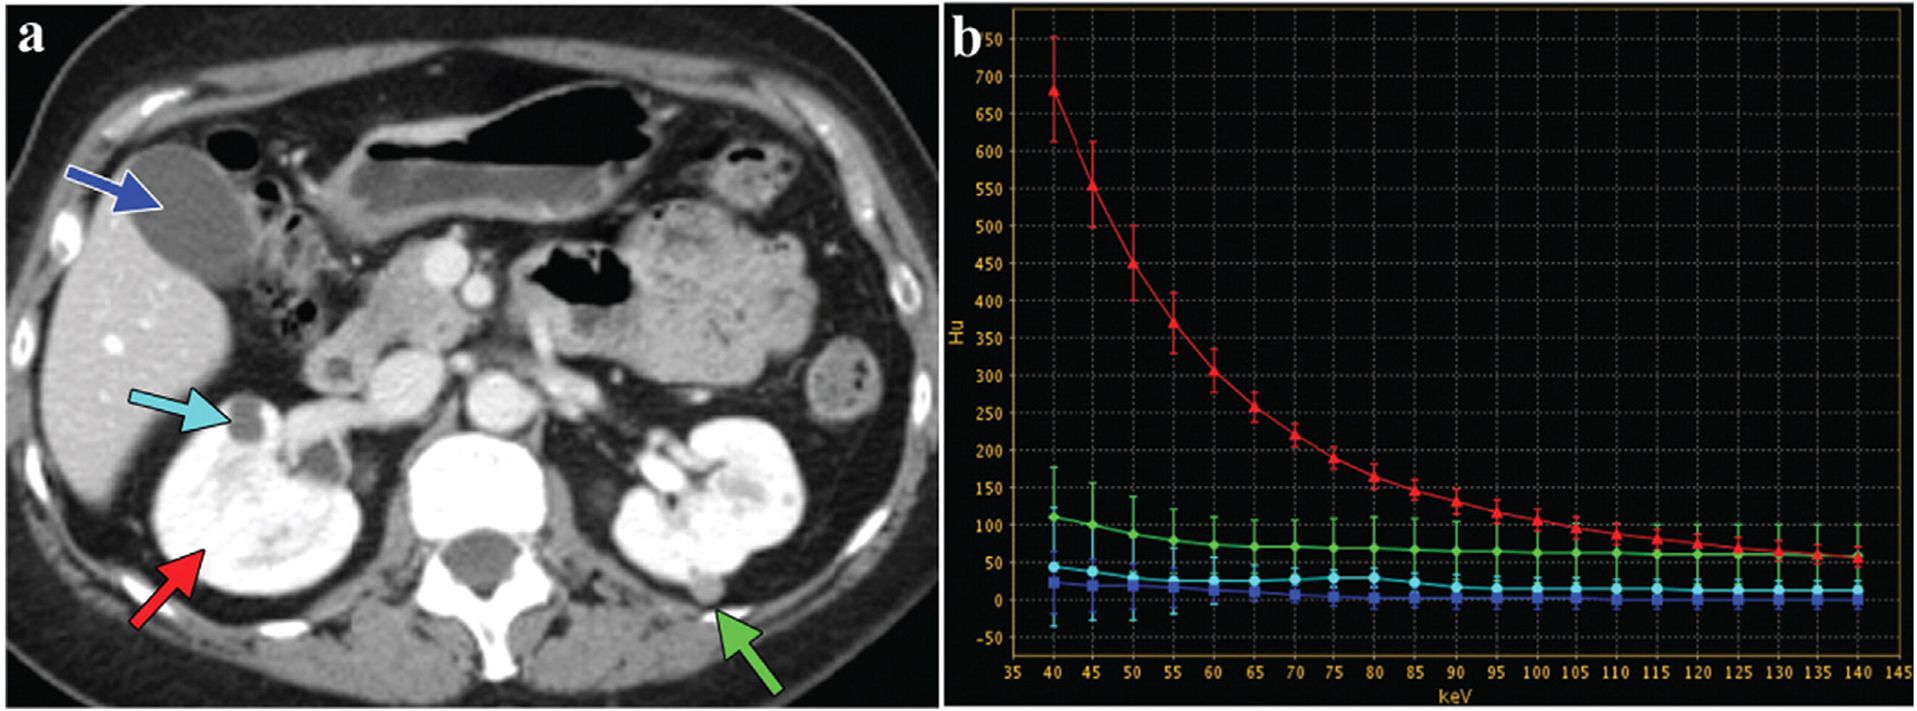
Dual-energy CT image of the abdomen (GE Healthcare). a) Abdominal cross section (The green arrow represents high-density lesion of left kidney; the light blue arrow is low-density lesion of right kidney; the red arrow is normal kidney enhancement; the deep blue is normal gallbladder fluid). b) Energy spectrum curves of different ROI. Reproduced from Ref. [13] Copyright 2011, RadioGraphics.