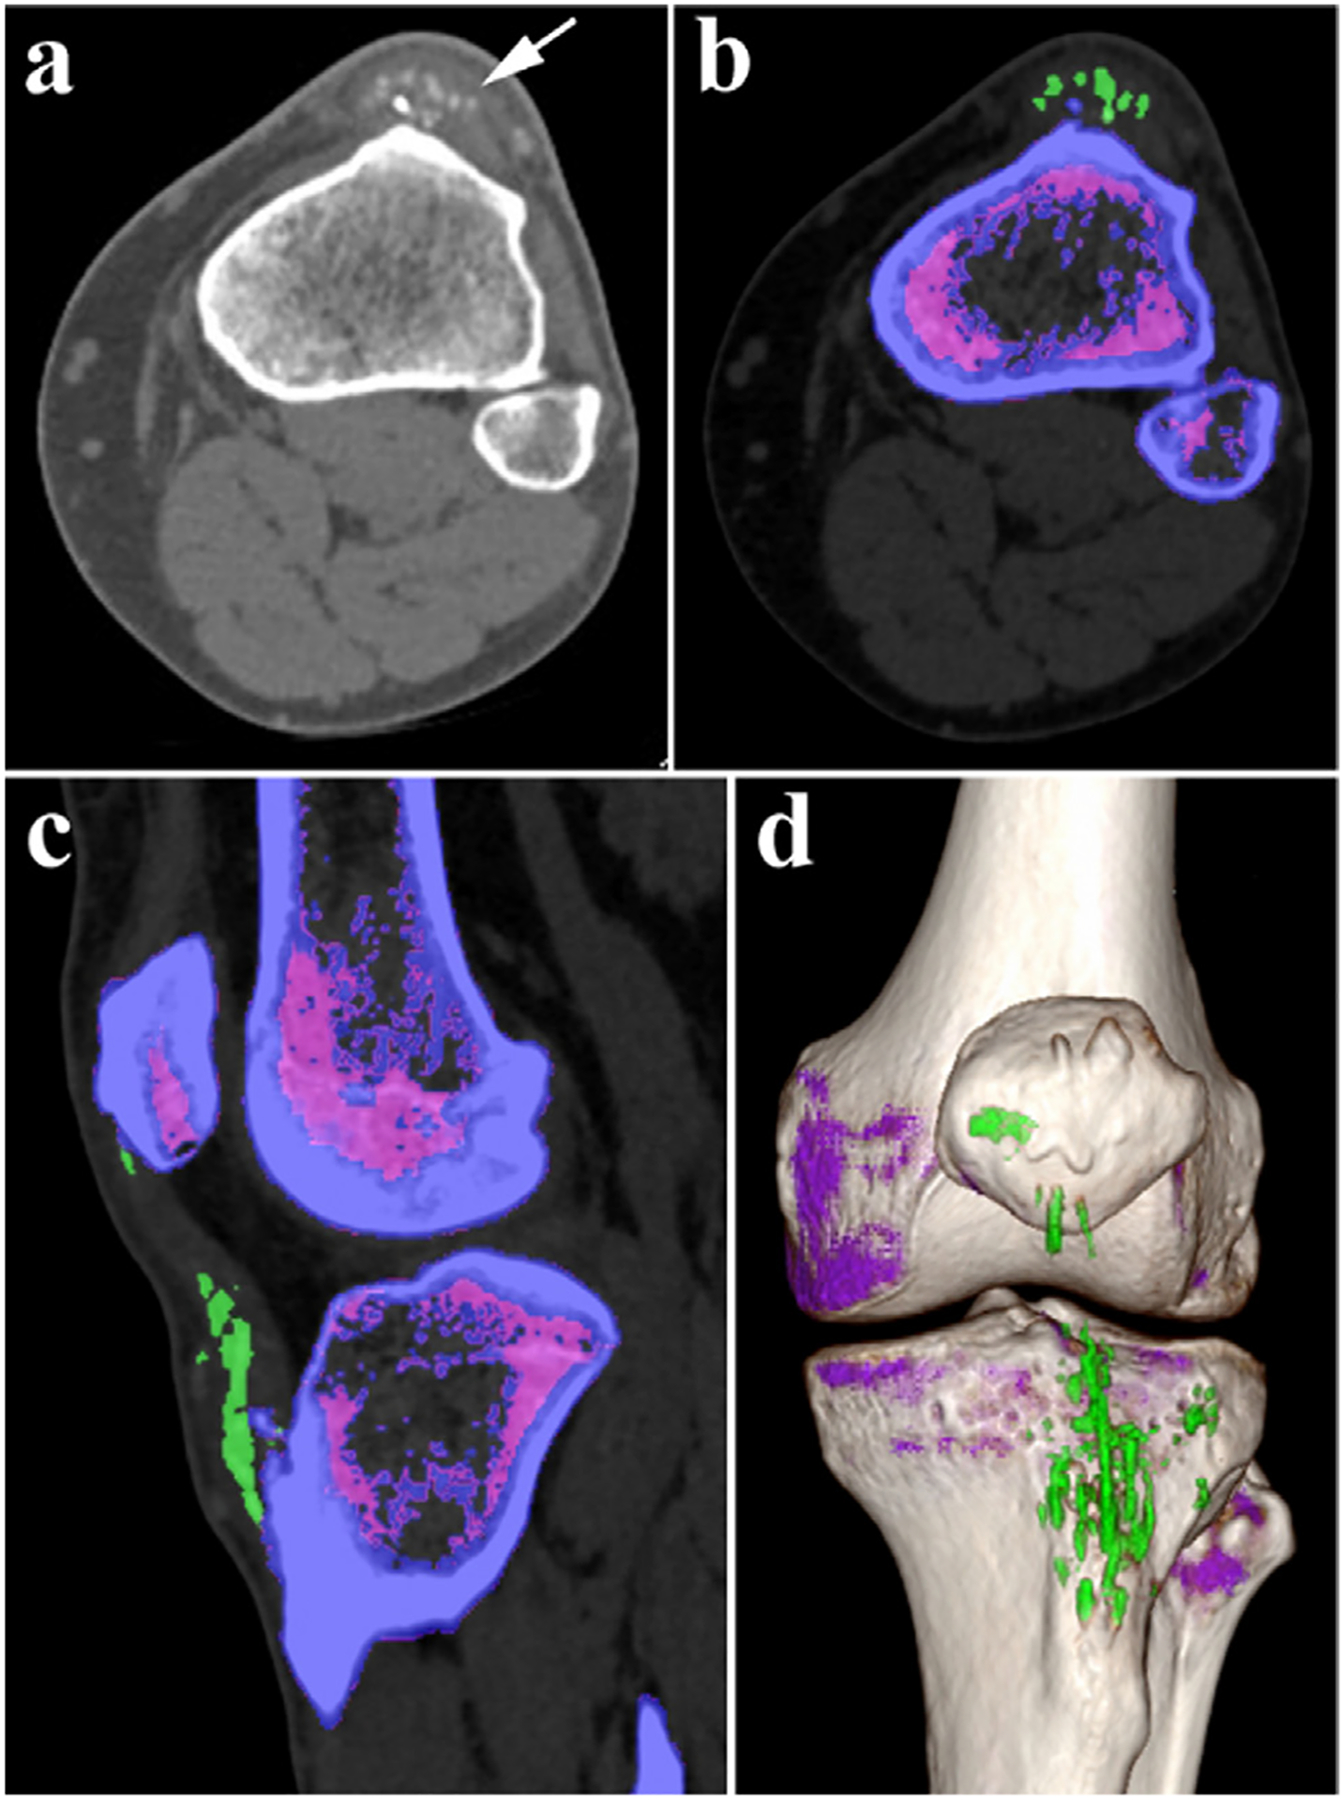
Fig. 5.

Dual-energy CT BMD image of left tibia (Siemens Healthcare). a) Gray image on conventional CT scans. b-d) Color image after gout procedure on DECT (the green represents uric acid, and the purple represents no uric acid). b) Cross section. c) Sagittal section. d) 3D reconstruction. Reproduced from Ref. [58] Copyright 2016, Radiology.
