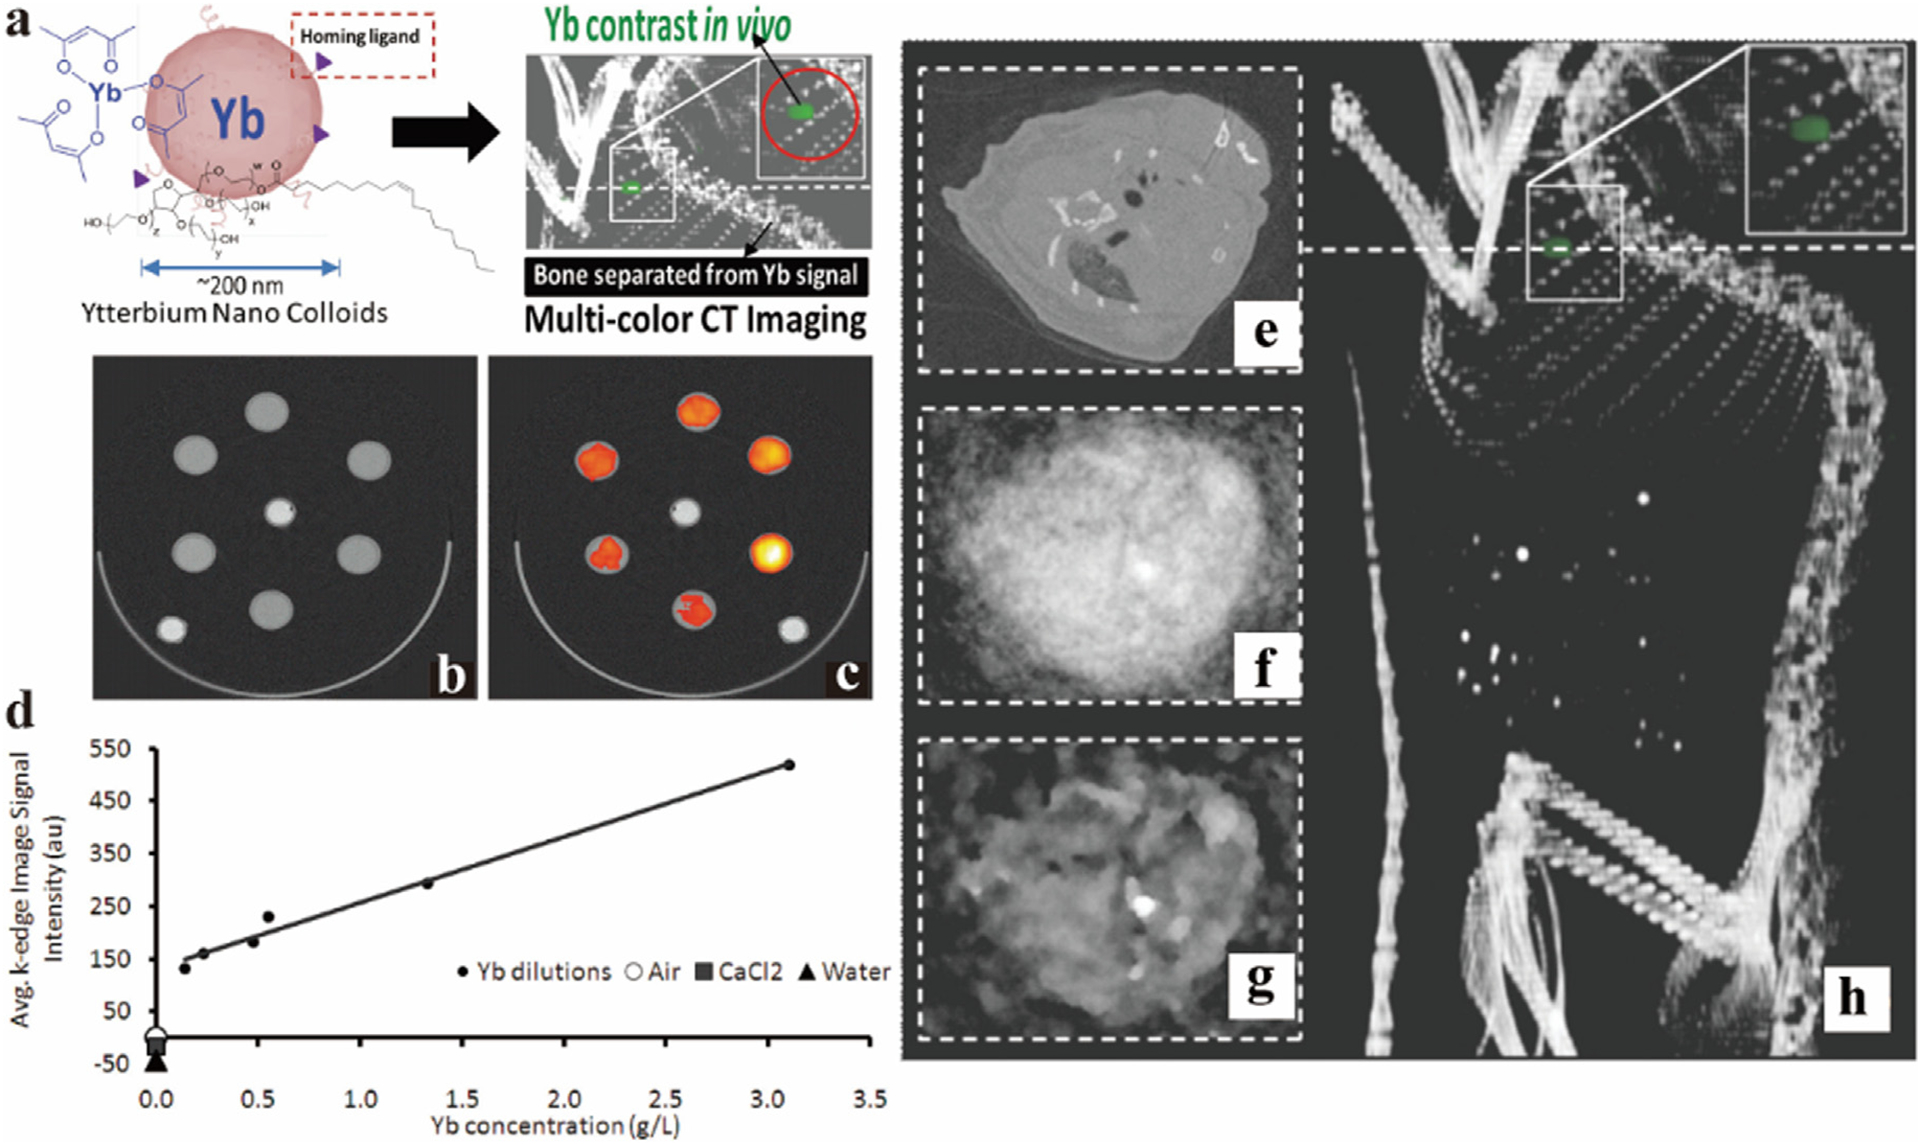
Fig. 8.

Studies on Yb-based NC CAs. a) Synthesis schematic of YbNC. b) Traditional CT images of diluted solutions of Yb, agarose and calcium chloride in the test tubes, respectively. c) Quantitative image of spectral CT (yellow represents higher Yb concentration, red represents lower concentration). d) Linear curve of Yb concentration measured value by spectral CT and ICP-OES. e-h) Blood pool image (heart cross section) of YbNC in traditional CT, normal image, iterative image, and 3D reconstruction of spectral CT (Philips Healthcare). Reproduced from Ref. [123] Copyright 2012, ACS Nano.
